¶ Overview
Sumo features additional layers of energy and cost calculations, based on the process model. The energy mode can be used to assess the electricity demand of aeration, mixing, pumping and other equipment operation, as well as the available potential to produce electricity from biogas produced in digesters (enabling self-sufficiency assessment and scenario analysis for energy savings). The cost layer can be useful for evaluating and improving plant operation from an economic standpoint, by comparing the various cost items associated with the components of the energy balance and the usage of chemicals. In this chapter, an overview of the possibilities will be presented, based on the example project built in the Using Sumo for simulations chapter.
¶ General settings
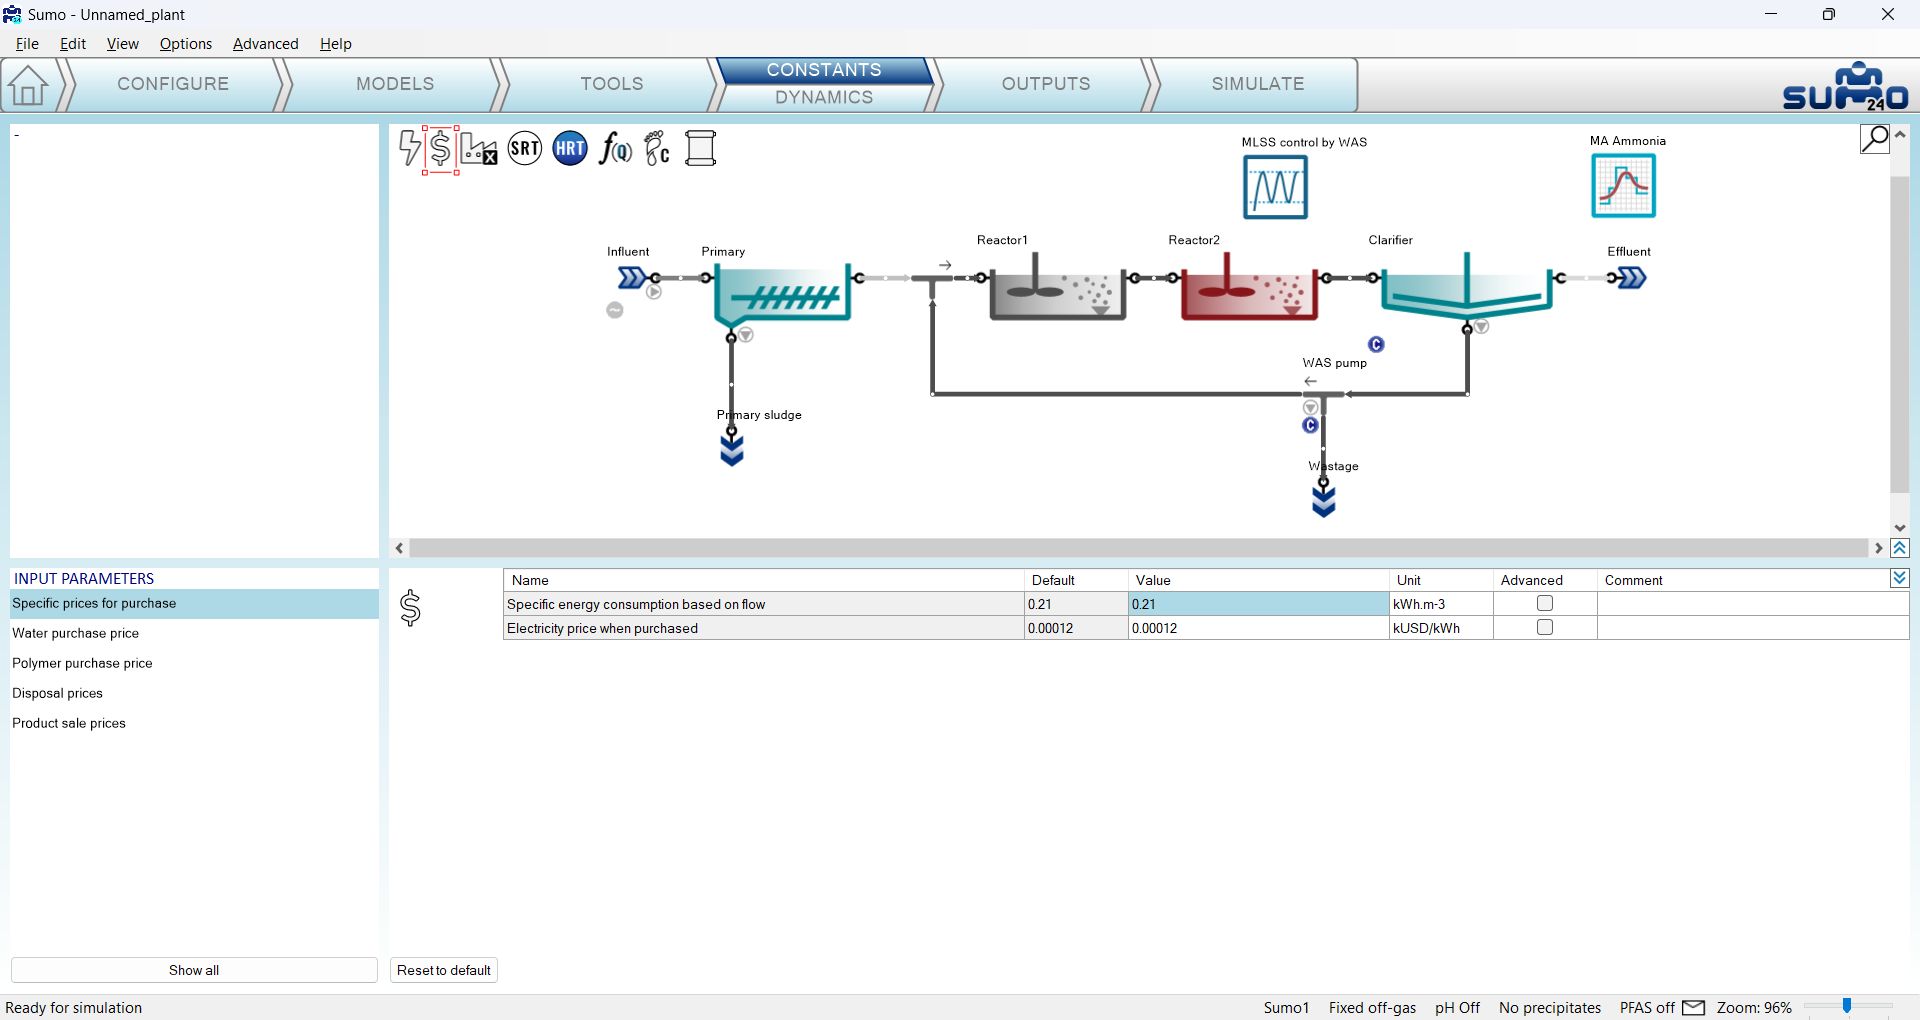
The status of the energy and cost layers is indicated by the first two icons in the top left corner of the plant layout screen panel (Figure 5.1.1). By default, the energy mode is inactive and cost calculations are limited to basic inputs. While the energy mode is inactive, the cost center can be supplied with input data by selecting the $ icon in the Inputs tab. At this level, simple specific prices can be defined for electricity, water and polymer usage, as well as disposal fees and product sales (Figure 5.1.2).

In order to fully exploit the capabilities of cost calculation, the energy mode shall be activated. This can be done by double-clicking on the Energy center icon (which will turn to yellow) or right-clicking it and selecting “Turn Energy On”. Along with this, the Cost center icon will turn to black from hollow, and the specific price input options will also adapt to the energy mode (as well as the underlying cost calculations).
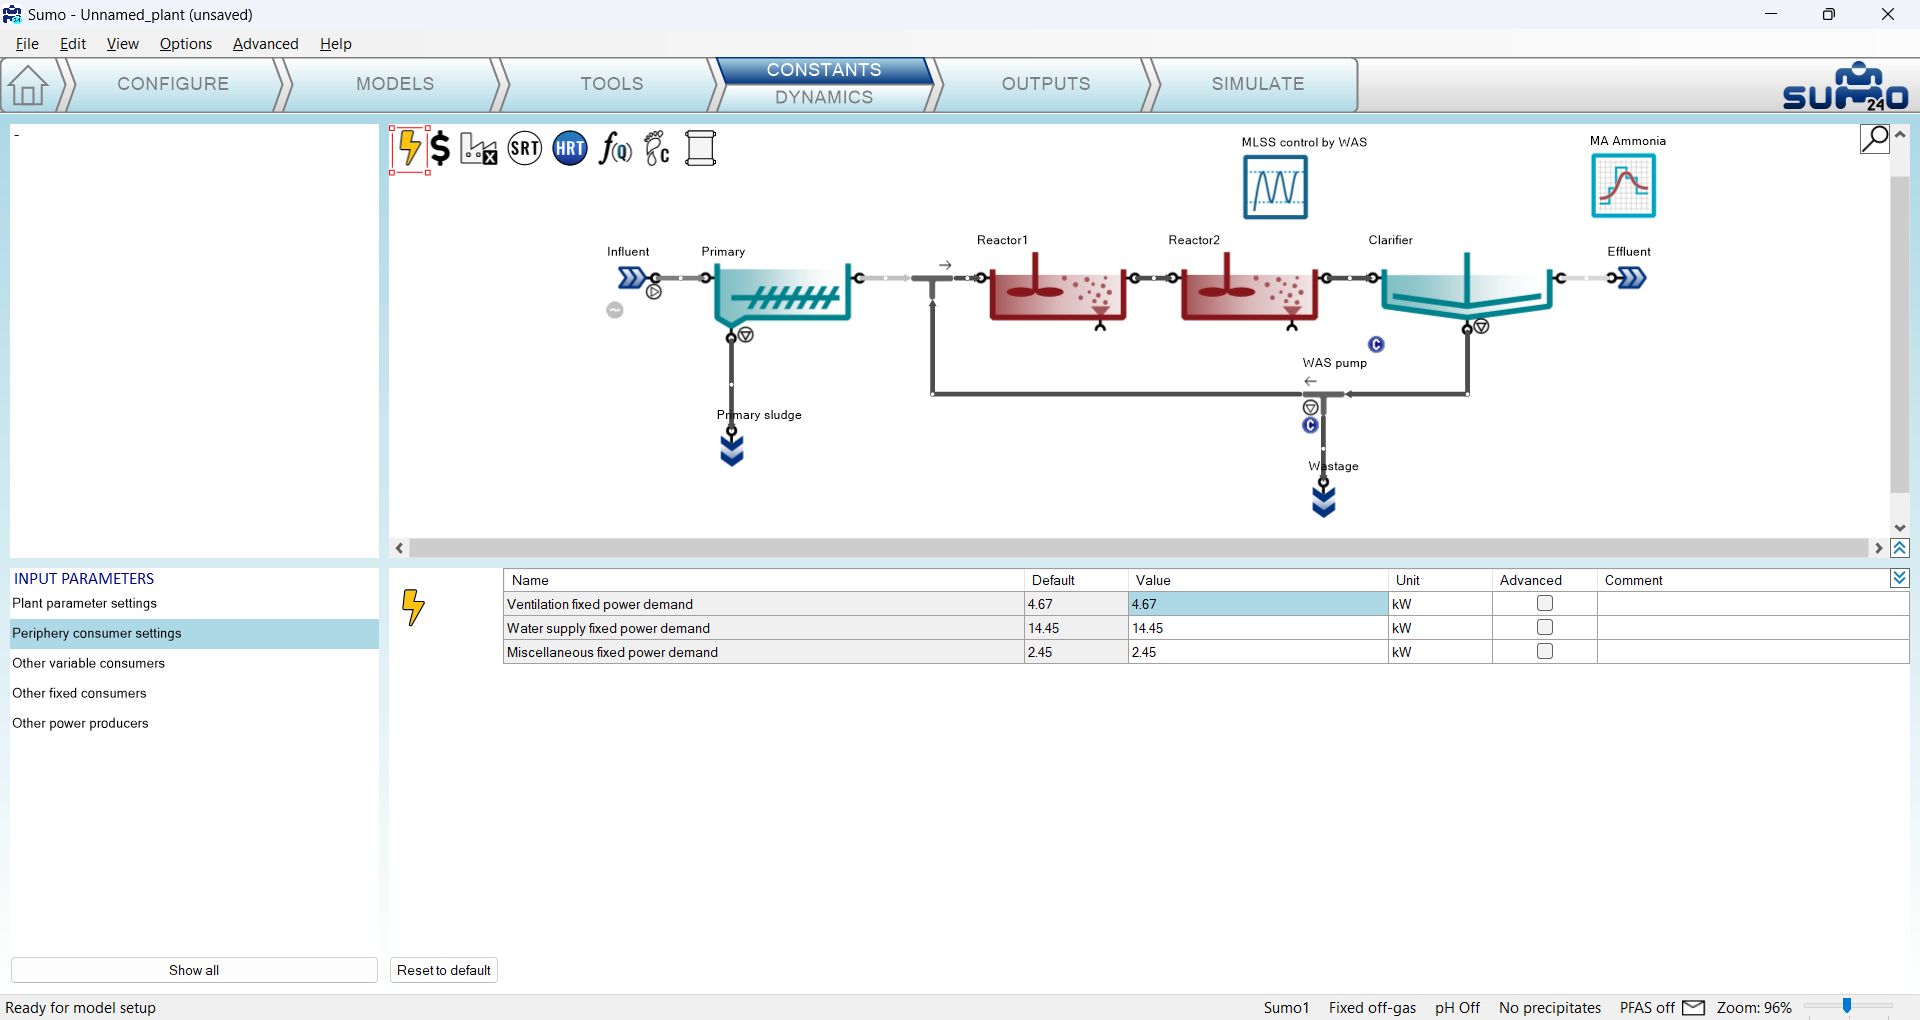
The Energy center plantwide input parameters are also available on the Inputs tab, by selecting the lightning bolt icon (Figure 5.1.3). Here you can specify general energy consumers that are grouped into periphery consumers (ventilation, water supply and miscellaneous), other variable and fixed consumers, as well as different on-site electricity producers and power storage options (depending on the settings of the Configure tab, see below).
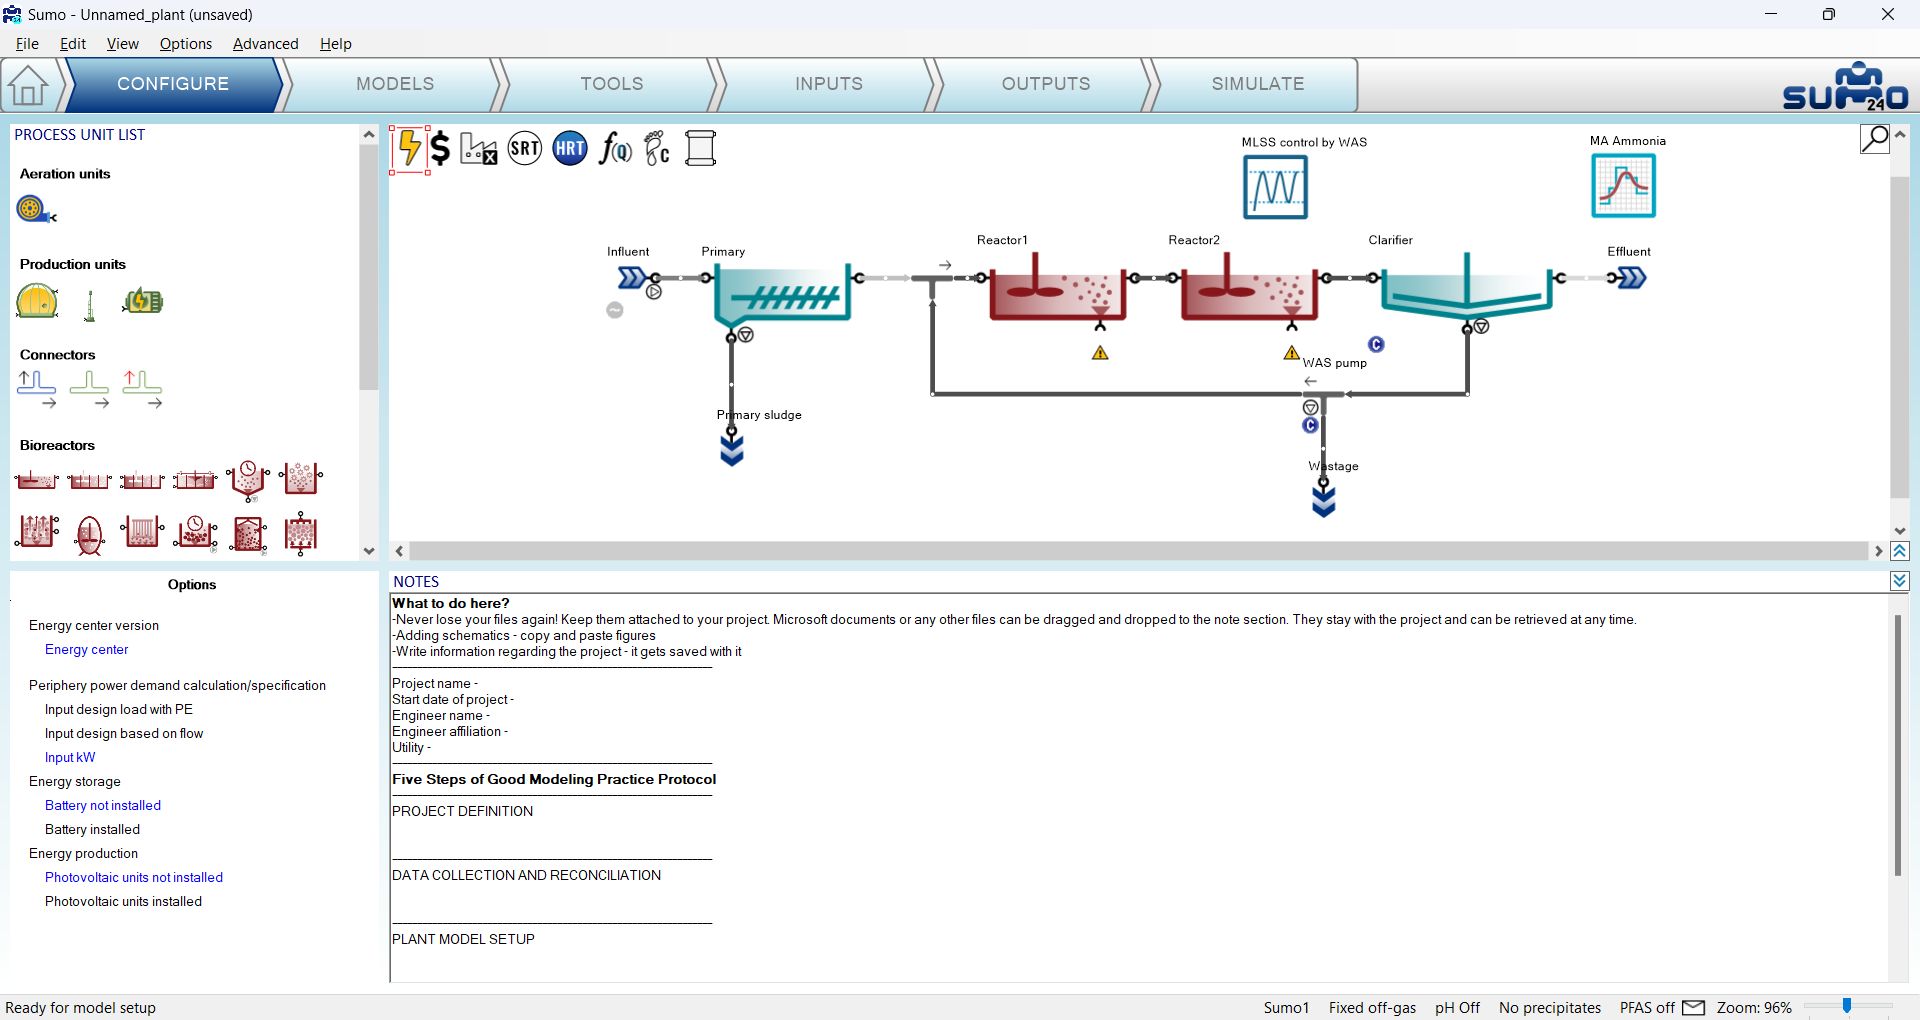
Apart from the plantwide inputs, the Energy layer has a lot more to offer. Moving over to the Configure tab, you will see that the process unit library got extended with three new categories: Aeration units (blowers), Production units (biogas tank, CHP unit and flare) and Connectors (for gaseous phase flows – air and biogas). It is also on this page (in the bottom left window pane, Options), where you can specify whether the periphery power demands should be calculated based on PE (Population Equivalent) load, flow or entered directly in kW. Likewise, you can specify whether the plant has PV units or batteries installed as on-site electricity production and storage options. (Figure 5.1.4). For now, we will leave the Energy center option settings at the default choices (no batteries and no PV capacity).
¶ Adding blowers and pumps
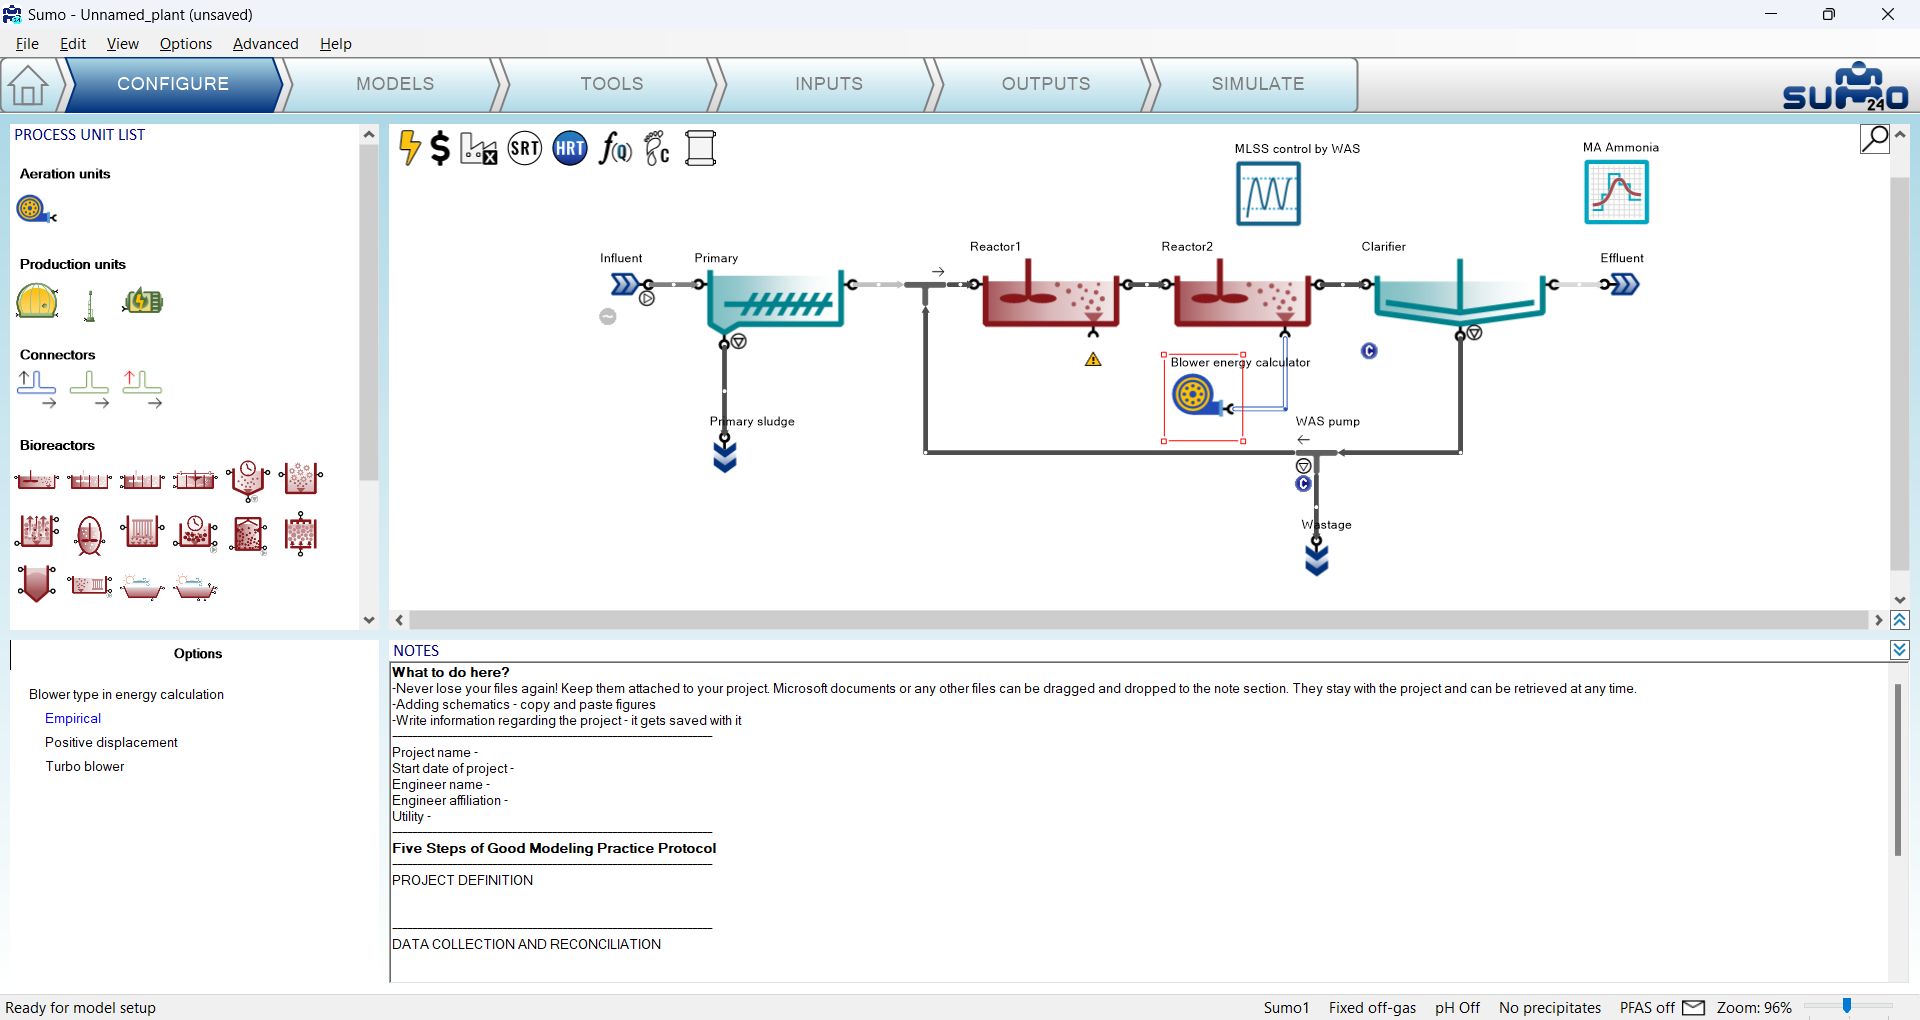
While on the Configure tab, let us extend the plant layout by adding a blower unit to the second reactor, connecting it to the air input port that appeared at the bottom of the reactor (Figure 5.2.1). Technically, we could attach another blower unit to the first reactor as well (or use an air connector unit to split the air flow from one blower to the two tanks), however, since it is not aerated, the air flow demand would be zero, thus there is no need for a blower there.
In the process unit options, you can specify between simple empirical (default), positive displacement and turbo blowers. The latter two come with delicate calibration tools that are available from the Inputs tab (just like the Influent tool), which offer full customization capabilities, based on blower manufacturer data. These tools are described in more detail in the Technical Reference. For our example, we will stick with the empirical blower.
You may also have noticed that the appearance of the pump icons by the influent, the clarifier and the flow splitter process units slightly changed. When the energy mode is active, you can specify different pumping options for these process units in the bottom left screen panel; including gravitational flow (no pumping), empirical pump model (default), as well as more detailed centrifugal, displacement and screw pump models (Figure 5.2.2). The latter ones feature elaborate tools that are available from the Inputs tab, offering detailed pump customization based on manufacturer data. To learn more about these tools, the reader is referred to the Technical Reference. For this simple example, we will keep all pumps with the simple empirical model (default setting). It is also possible to assign pumps to the individual pipes by selecting them and specifying the pump type (there will be no visual notation of these pumps on the drawing board, but they will be included in the energy and cost calculations).
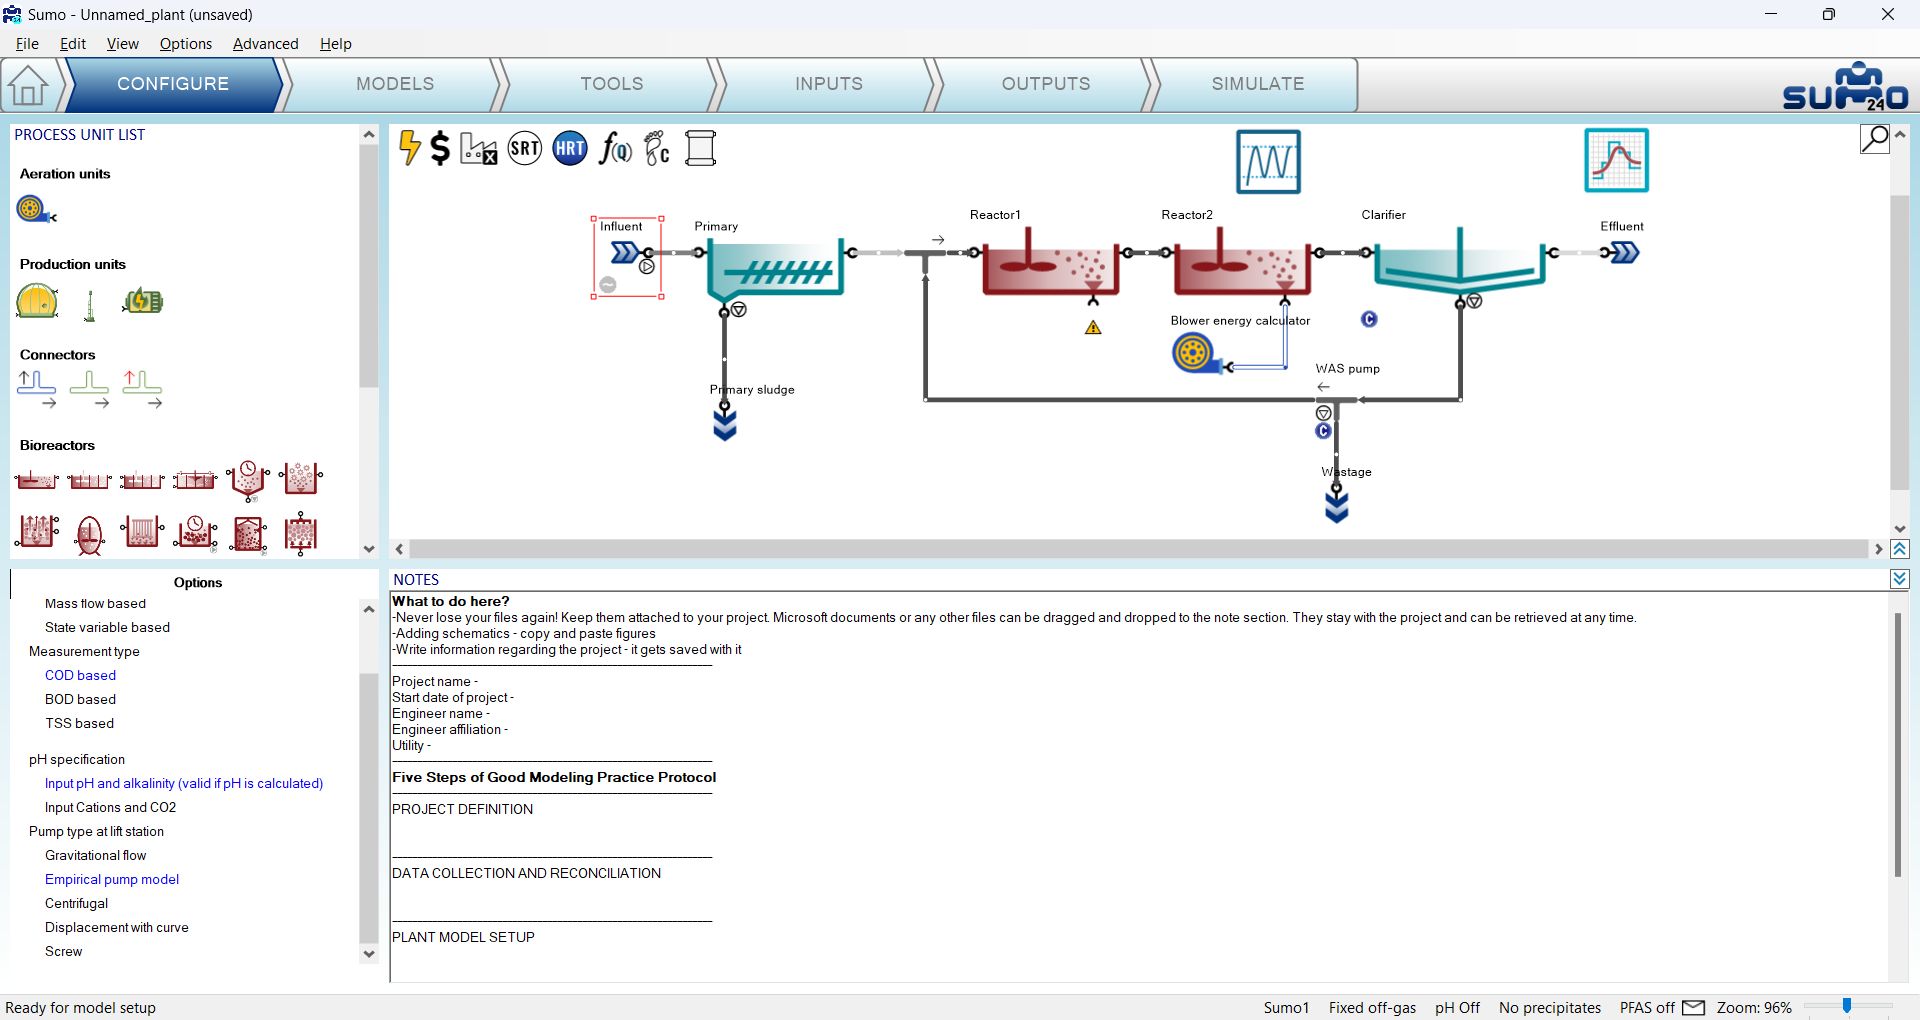
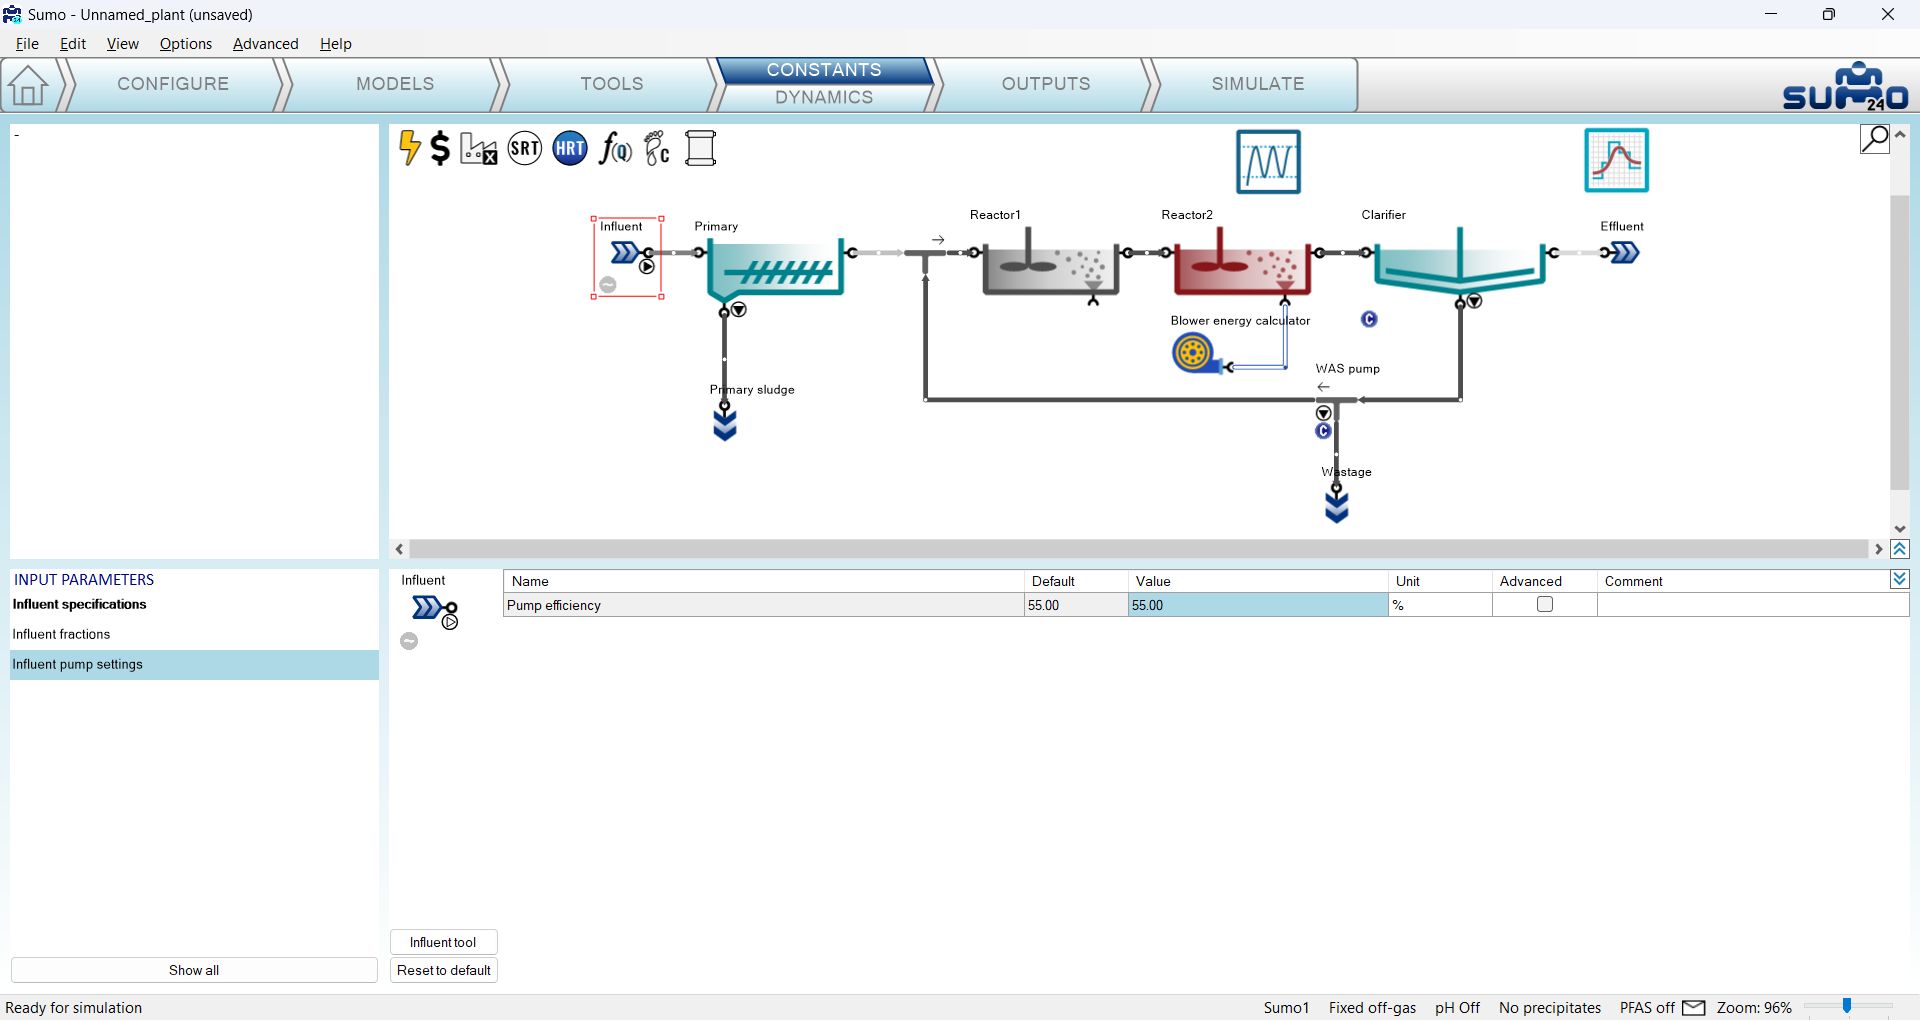
Moving over to the Inputs tab, the plant model will start to be recompiled (which is necessary for adding the extended features of the energy mode). The appearance of the pump icons will change from ‘not in operation’ to ‘in operation’ and the pump settings (in our example the efficiency) can be specified in the input parameters of the respective process units, one by one (as demonstrated for the influent on Figure 5.2.3). When using one of the detailed pump models, an extensive set of parameters will be available, which should be used in conjunction of the respective pump tool.
Similarly, the main input parameter for the blower in our example will be the efficiency, while selecting one of the more detailed blower models will require a range of additional parameters, whose proper calibration shall be performed using the respective blower tool.
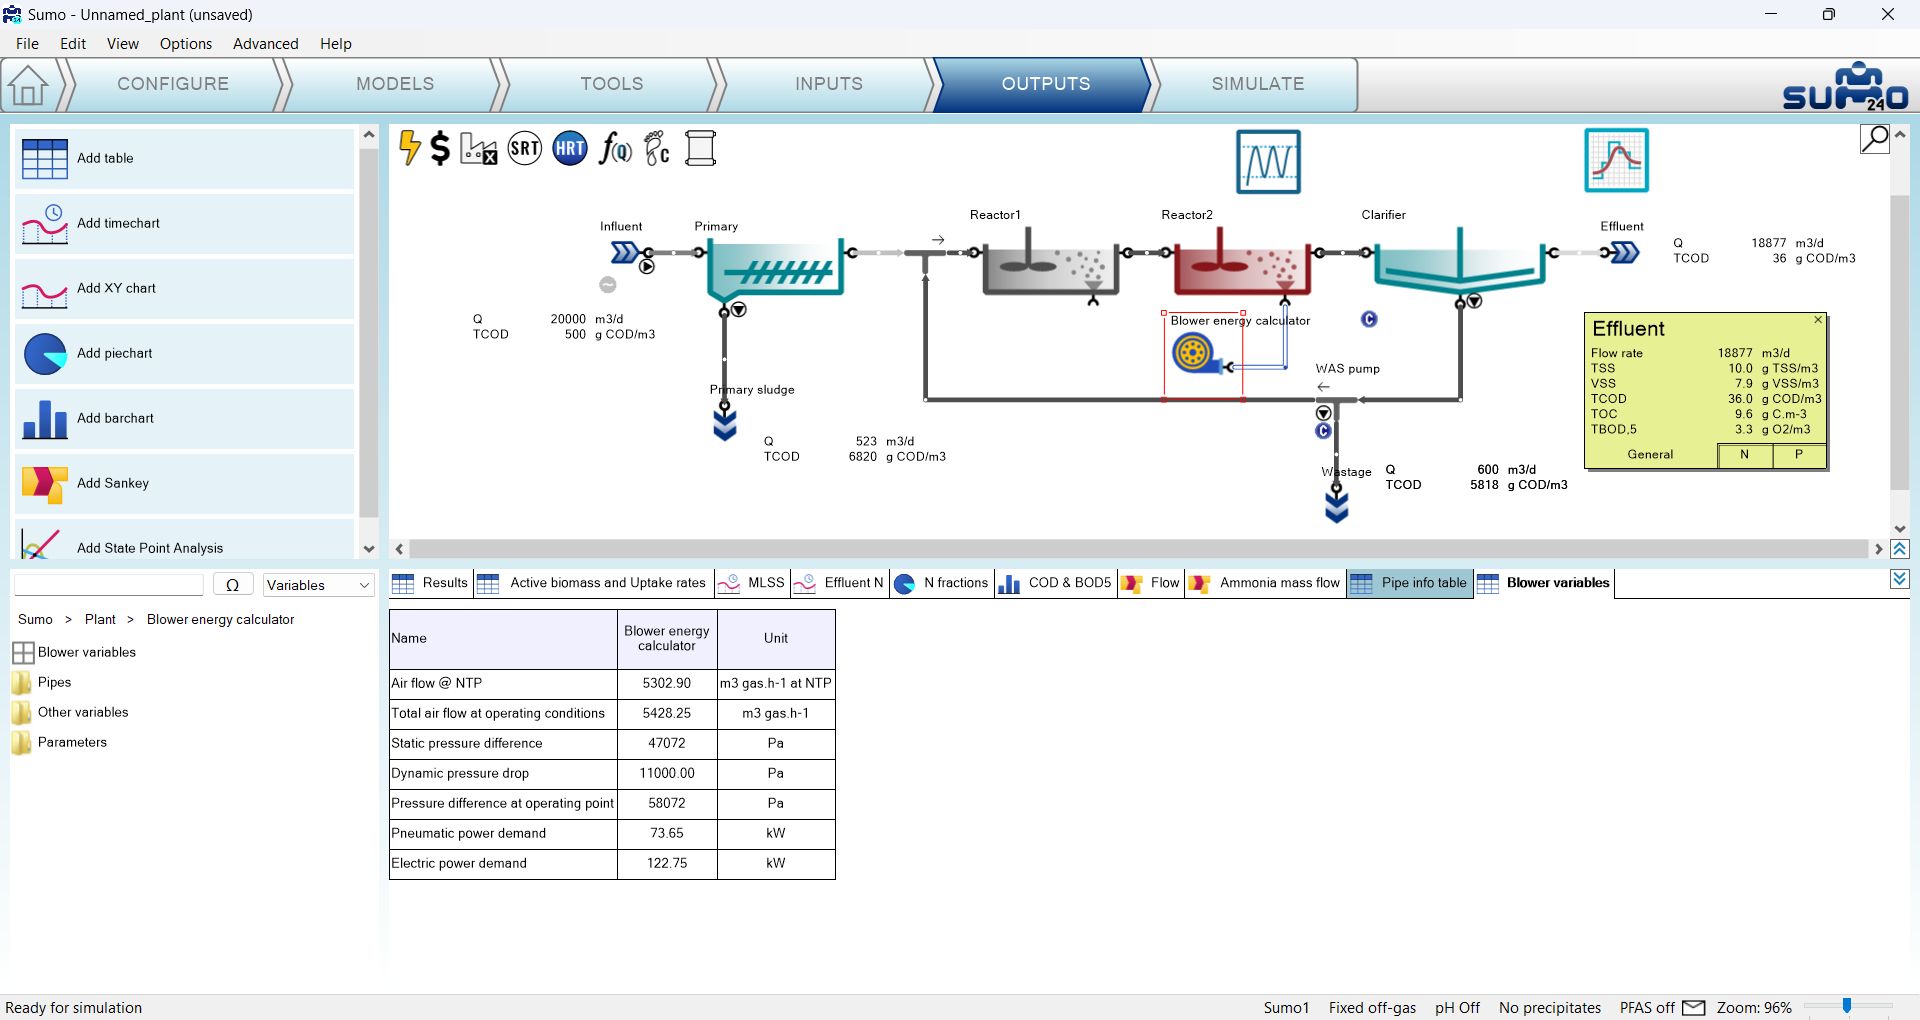
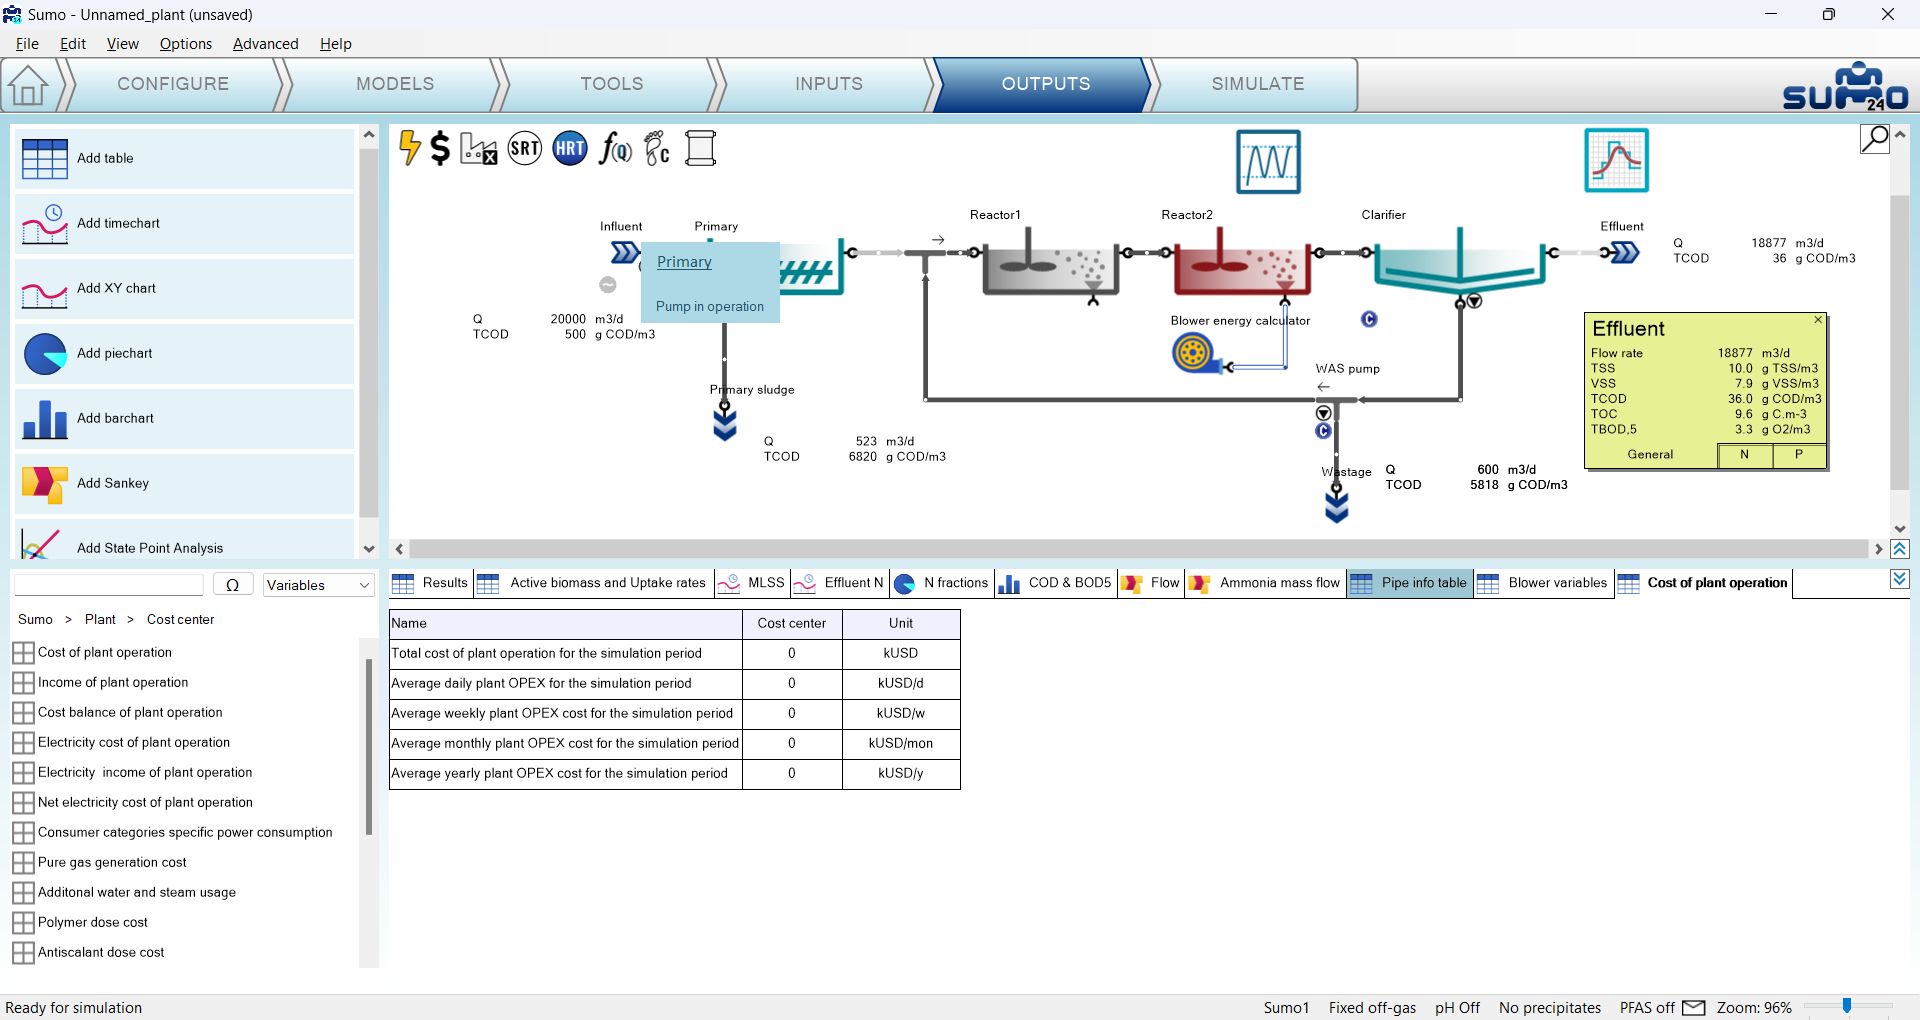
Moving over to the Outputs tab, we can add various energy and cost related output information; such as a blower variables table by selecting the blower unit, adding a table and dragging over the Blower variables group (Figure 5.2.4); an overview table of plant operation costs for the given simulation period by selecting the Cost center icon, adding a table and pulling the Cost of plant operation variable group over on it (Figure 5.2.5); or piecharts showing the share of different energy consumer groups and categories in the plant by selecting the Energy center icon, adding piecharts and dragging over the respective variable groups to the charts.
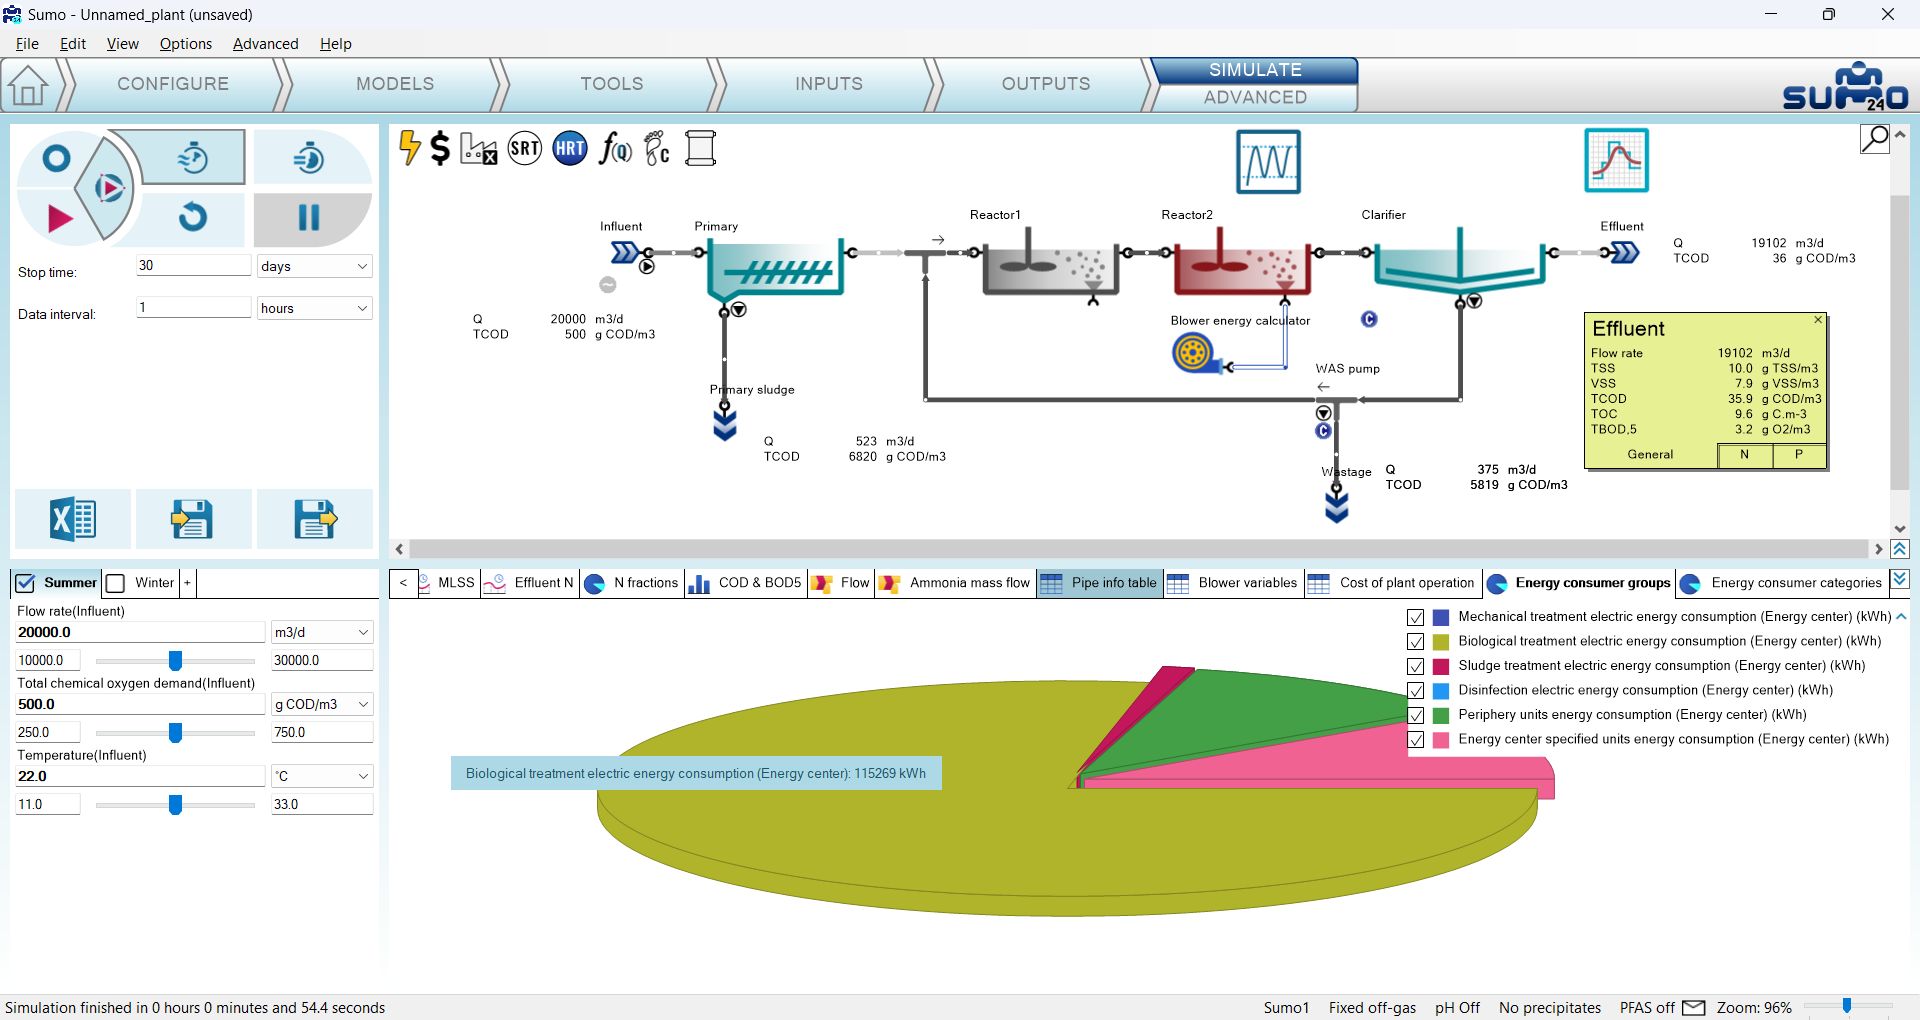
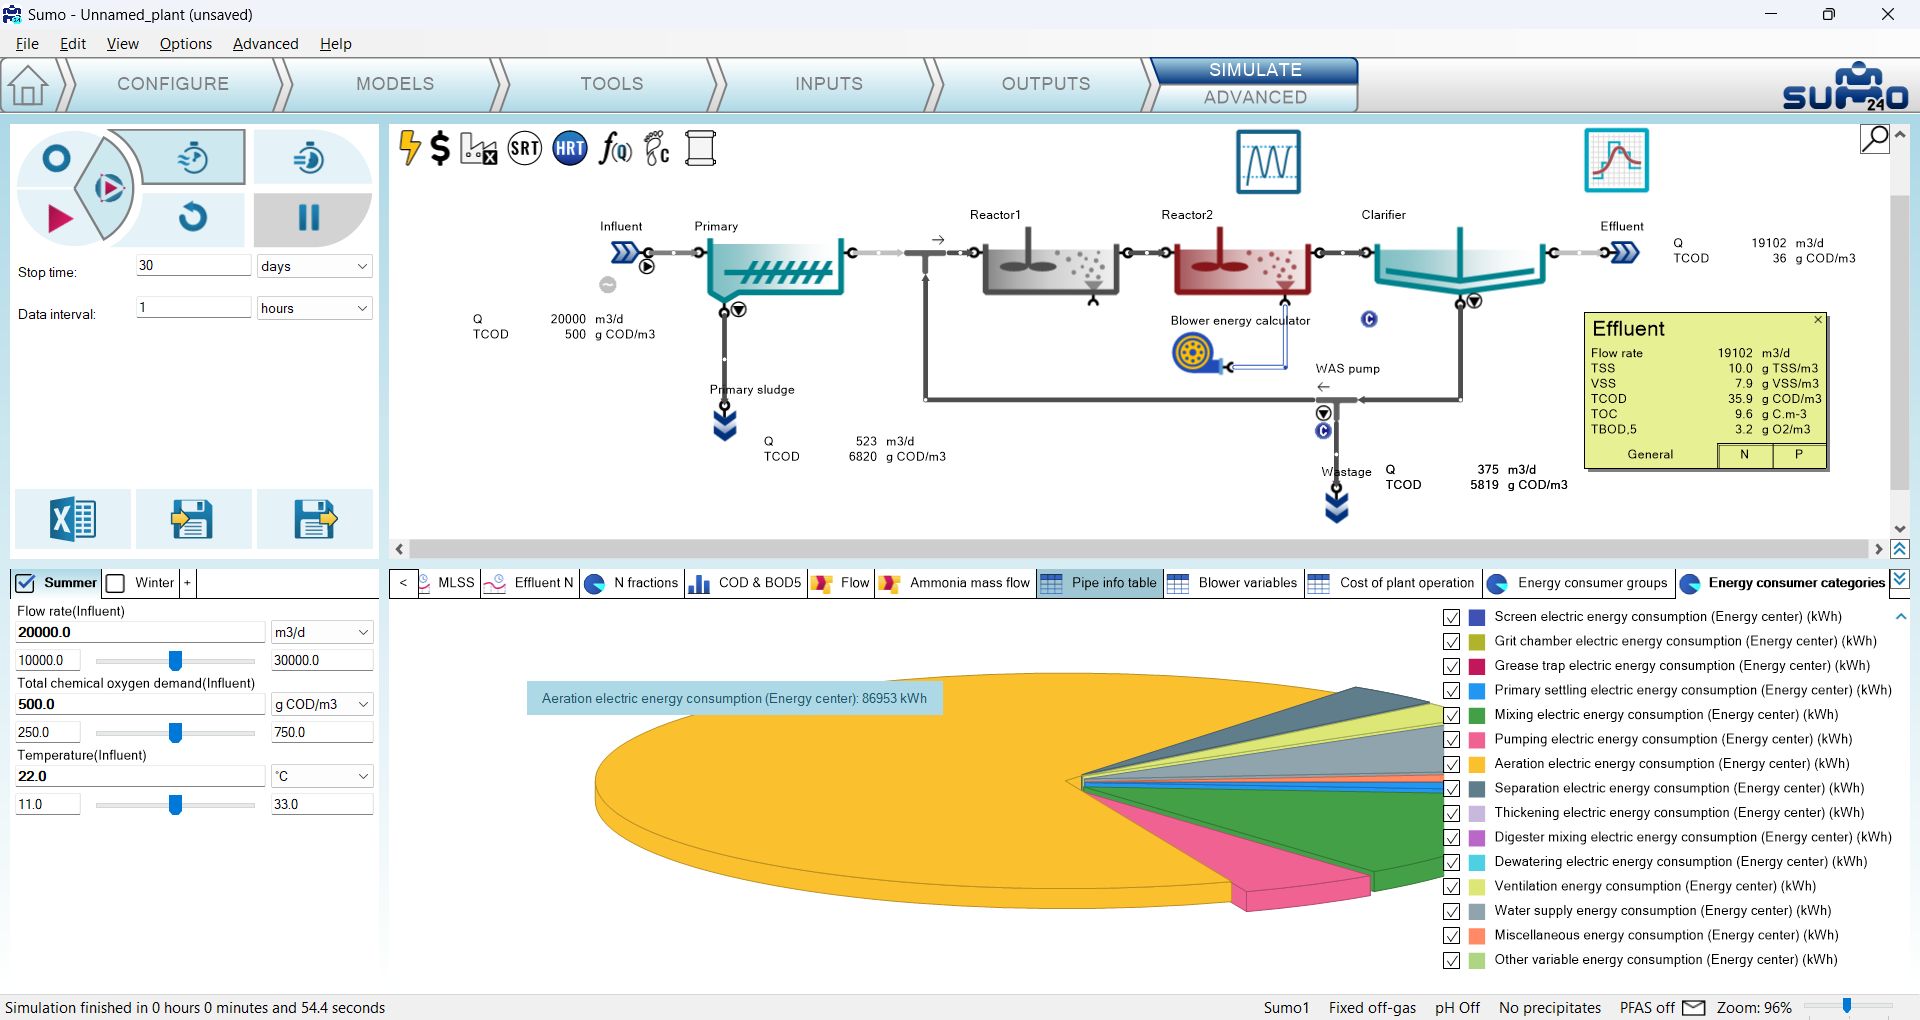
On the Simulate tab, after running a 30-day dynamic simulation from steady-state, you can review the energy and cost related information calculated by the model for this period. For example, it can be seen that most of the energy demand in this simple tutorial example comes from the electricity consumption of the biological treatment (Figure 5.2.6); basically aeration and mixing (Figure 5.2.7).
You can add various other energy and cost related outputs to analyze the performance of the plant in more detail, as well as extend the blower/pump models by specifying and calibrating the more detailed model options.
¶ Plants with biogas production
The usage of energy units associated with sidestream treatment (biogas tank, CHP unit, flare) is demonstrated by three of the factory examples: Tutorial Plant 2 with energy, AB plant with energy, UASB plant with energy.
¶ Next chapters
Chapter 6 – Carbon footprint assessment
Chapter 7 – Design model
Chapter 8 – Examples