¶ Overview
This chapter will explain the plantwide feature that enables the carbon footprint (CFP) assessment of plant operation for a given period, based on the process model and optionally, the energy calculations.
¶ Methodology
CFP assessment takes account of greenhouse gas (GHG) emissions related to the investigated activity. In the case of the wastewater industry the associated GHGs are CO2, CH4 and N2O (in general, there are number of other GHGs, however those are not characteristic of wastewater treatment processes). The assessment can address three levels, referred to as Scope 1, 2 and 3 (Table 6.1.1). Scope 1 covers direct GHG emissions originating from the processes, while Scope 2 and 3 deal with indirect emissions (the former is dedicated to GHG emissions pertaining to the supply of energy demands, the latter covers all other third-party GHG emissions, such as chemicals production, transportation of materials and personnel to and from the facility, etc.). By its nature, the choice of boundaries for Scope 3 can be very arbitrary, and often some crucial information elements needed for proper accounting are uncertain or biased. Thus, for comparative studies it is rather advisable to settle with Scope 1 and 2 carbon footprint assessment. The Sumo CFP tool provides these two levels.
Table 6.1.1 – Scopes of carbon footprint assessment.
| SCOPE 1 | Direct emissions from the investigated process |
|---|---|
| SCOPE 2 | Indirect emissions from energy consumption (imported power from external sources) |
| SCOPE 3 | Other indirect emissions associated with the process (external, third-party emissions) |
The status of the CFP calculation mode is indicated by the footprint icon in the top left corner of the plant layout screen panel (Figure 6.1.1). By default, CFP is disabled. To enable it, double-click on the CFP icon (whose image will change, depending on further conditions, see Table 6.1.2) or right-click and select “Turn carbon footprint calculations on”.

For carbon footprint assessment heavily relies on the proper estimation of off-gas mass flows, it is a requirement to have “Calculate gas phase concentrations” selected in the Gas phase category of Model options on the Models tab. As long as the “Input gas phase concentrations” option is selected, the CFP icon will be hollow red when turned on, indicating that an additional model option choice must be made before CFP calculations become active. With calculated off-gas, the icon will change from hollow to black fill and the letter ‘C’ on its right side will change to ‘S1’ (referring to Scope 1) or ‘S2’ (referring to Scope 2), depending on whether the Energy mode is switched off or on, respectively. Without energy calculations, the CFP calculations obviously lack the information needed for Scope 2 coverage, hence the two distinguished signals. Nevertheless, both levels of assessment will be valid for comparison with other assessments that were made on the same level.
Table 6.1.2 – CFP icon images shown under various conditions.
| CFP OFF | CFP ON | ||
| fixed off-gas | calculated off-gas | ||
| Energy OFF | Energy ON | ||
 |
 |
 |
 |
When enabled, CFP will automatically gather the following information from the various process units that are part of the plant layout:
- Stripping rates of GHGs from bioreactors and other process units with reactive volume
- Fugitive biogas mass flows from digesters and dewatering units
- Biosolids handling (assuming on-site incineration or transportation for off-site treatment)
- Incomplete biogas combustion (when the Energy mode is enabled)
- Energy consumption and production (when the Energy mode is enabled)
Regarding the process emissions, carbon dioxide and methane are always calculated based on the process model: stripped gas mass flows are fetched from liquid stream bioreactors, while fugitive gas mass flows are collected from solid stream bioreactors (digester, UASB) and dewatering units. In the case of nitrous oxide, the methodology depends on the process model used for the simulation. If the model includes N2O as a state variable (for an explanation of what is a state variable, please see the Technical Reference), then its emissions are calculated according to the process model, just like for the other two GHGs (Tier 1 method). Otherwise, N2O emissions will only be estimated based on the influent TKN via a plantwide emission factor (Tier 2 method), which, depending on the configuration, can be highly variable (0.01% - 1.8%, for details see Ahn et al, 2010). It is important to highlight that the choice between the two approaches is made automatically by Sumo, using a check in the actual process model. Therefore, it is generally advised to use a process model that has N2O as a state variable (e.g. Sumo4N, which can be found under Focus models on the Models tab) in order to avoid high uncertainty in estimating nitrous oxide emissions.
In the case of process-derived carbon dioxide, an important requirement is that a CFP assessment should only take into account the fraction of emissions that originates from the breakdown of materials containing fossil carbon (e.g. cleaning products, pharmaceuticals, and other petroleum-based products present in the wastewater). The CO2 produced by natural processes (originating from biogenic carbon) must be excluded. Therefore, estimating the share of fossil carbon is important in the various material streams of the plant. This can vary considerably, depending on the composition of the raw wastewater. Sumo considers default values for mainstream, side stream, biogas and biosolids based on literature. These can be adjusted/tuned by the user (e.g. for sensitivity analysis or for special applications).
In the final step of a CFP assessment, the emissions of GHGs are converted to CO2-equivalent units using a conversion factor called Global Warming Potential (GWP), which is provided by the periodically published official reports of the Intergovernmental Panel on Climate Change (IPCC). GWP values differ from one GHG to another (by definition, the GWP of CO2 is always 1, the values for all other gases are relative to this reference) and also vary depending on the reference time horizon chosen for benchmarking (100 years is the most often used period). GWP values based on the 100 and 20 years time horizons are presented by Table 6.1.3 to demonstrate the considerable differences between the three GHGs under investigation and also, to support the recommendation for using process model based N2O emission estimations (in a CFP assessment, 1 kg of N2O will be equivalent to about 265 kg of CO2 emitted).
Table 6.1.3 – GWP values (source: IPCC)
| GWP | Reference time horizon | |
|---|---|---|
| 20 years | 100 years | |
| CH4 | 84 | 28 |
| N2O | 264 | 265 |
Regarding the CFP of energy consumption, the assessment must consider the specific CFP of the utilized power generation approach (which is most often a mixture). Various technologies have quite different associated CFP per unit of power produced (see Table 6.1.4). Thus, the energy mix in general, and sometimes its temporal variation as well, is an important factor to take into account. Sumo offers a tool that serves as a database for properly setting up Scope 2 CFP calculations.
Table 6.1.4 – Typical specific CFP values for various power producing technologies
| Technology | Specific CFP [g CO2-eq/kWh] |
|---|---|
| Hydro | 24 |
| Solar | 45 |
| Natural gas | 490 |
| Wind | 11 |
| Nuclear | 12 |
| Coal | 820 |
¶ Usage
For the demonstration purpose we will use the “A2O with P recovery and energy plus CFP” example project, which is available from the welcome screen, among the examples of the Nutrient removal tab.
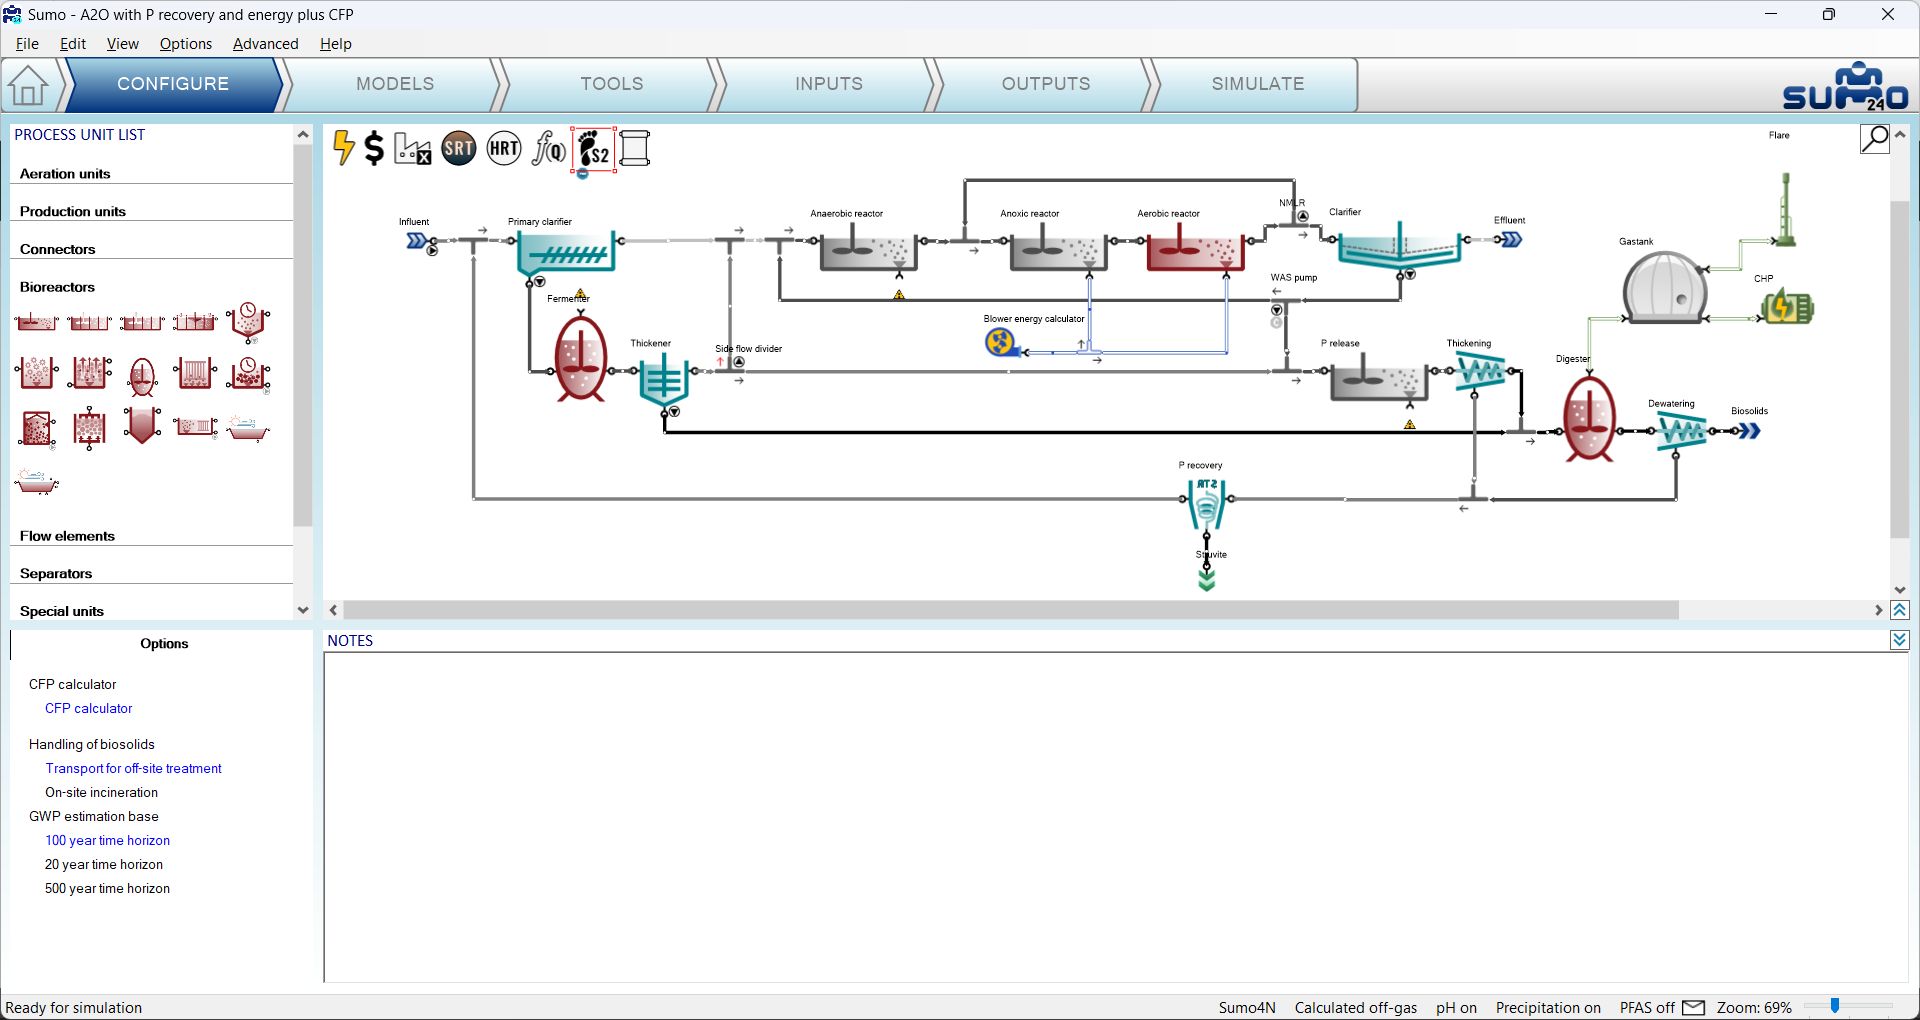
After opening the example project, while on the Configure tab, select the Carbon footprint icon (located in the top left part of the layout panel) in order to look at the CFP plantwide process unit options. As CFP calculations are already turned on in this project, the process unit options are visible in the bottom left window panel. This is the place where the handling method of biosolids and the time horizon for GWP estimation base can be specified (Figure 6.2.1).
¶ Inputs
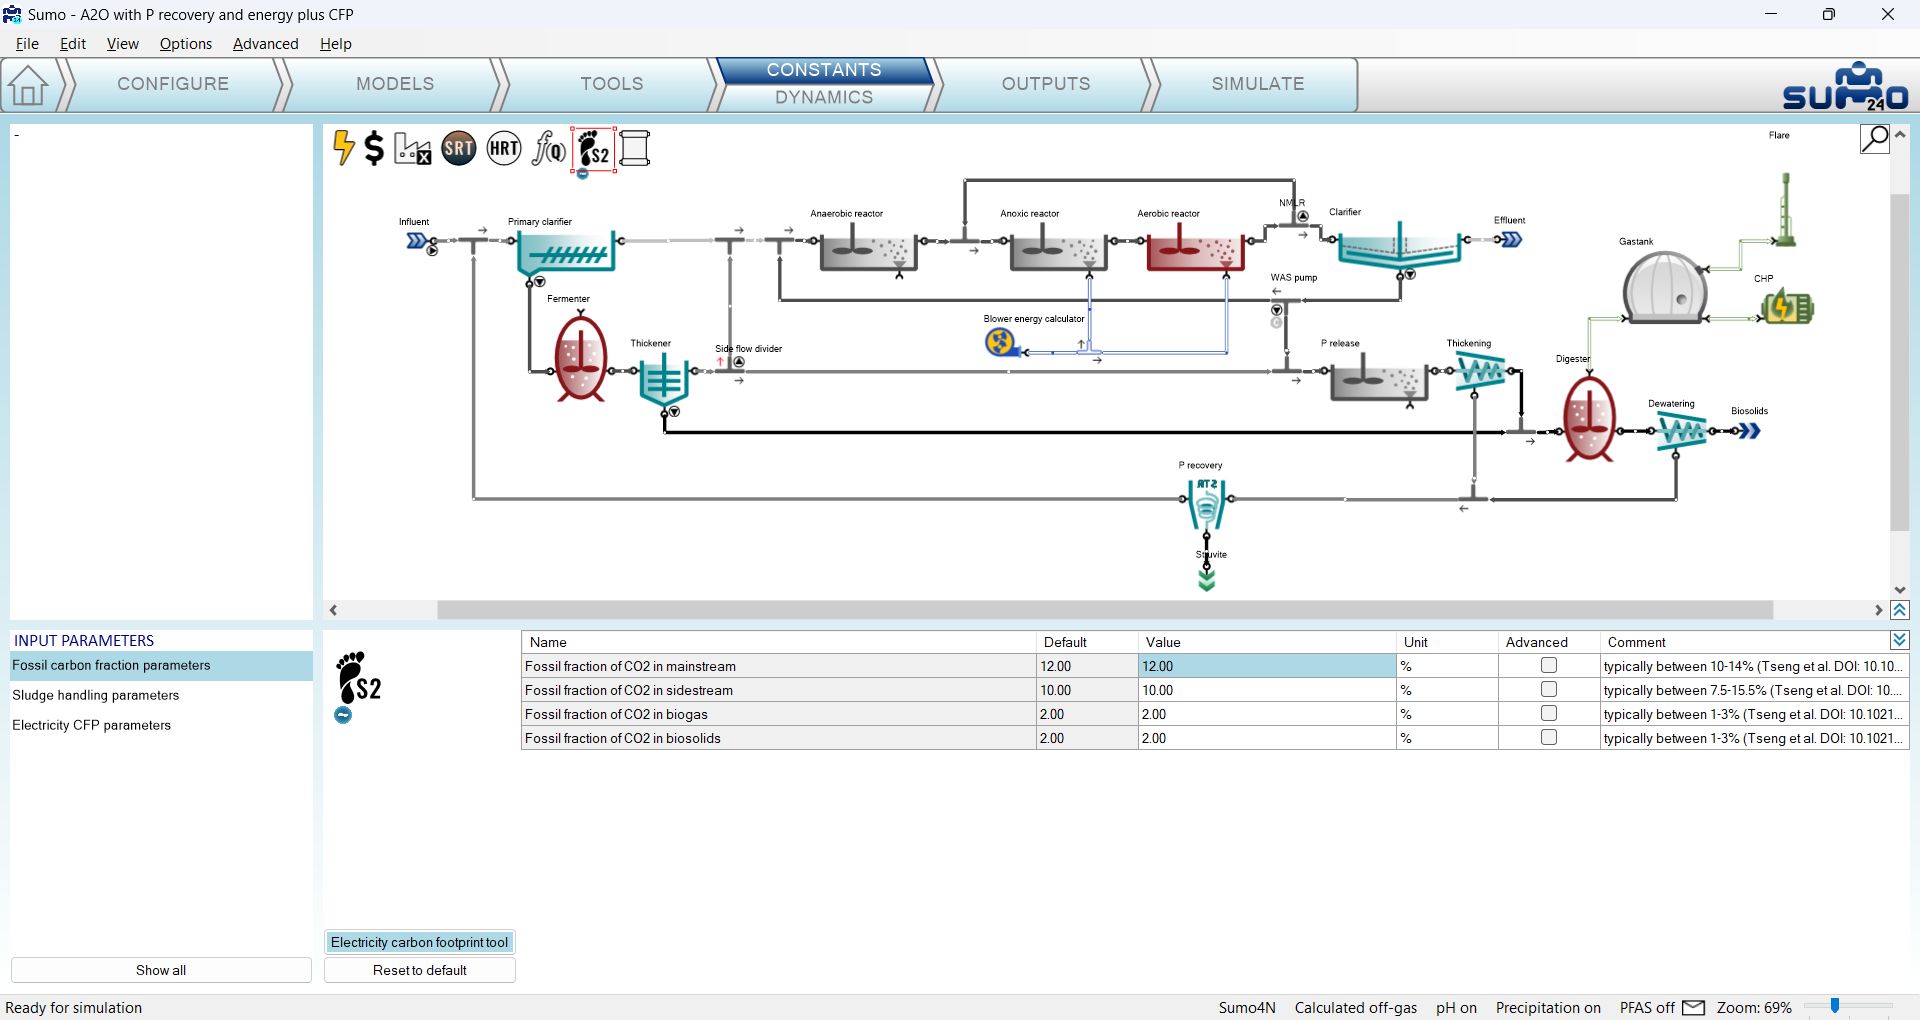
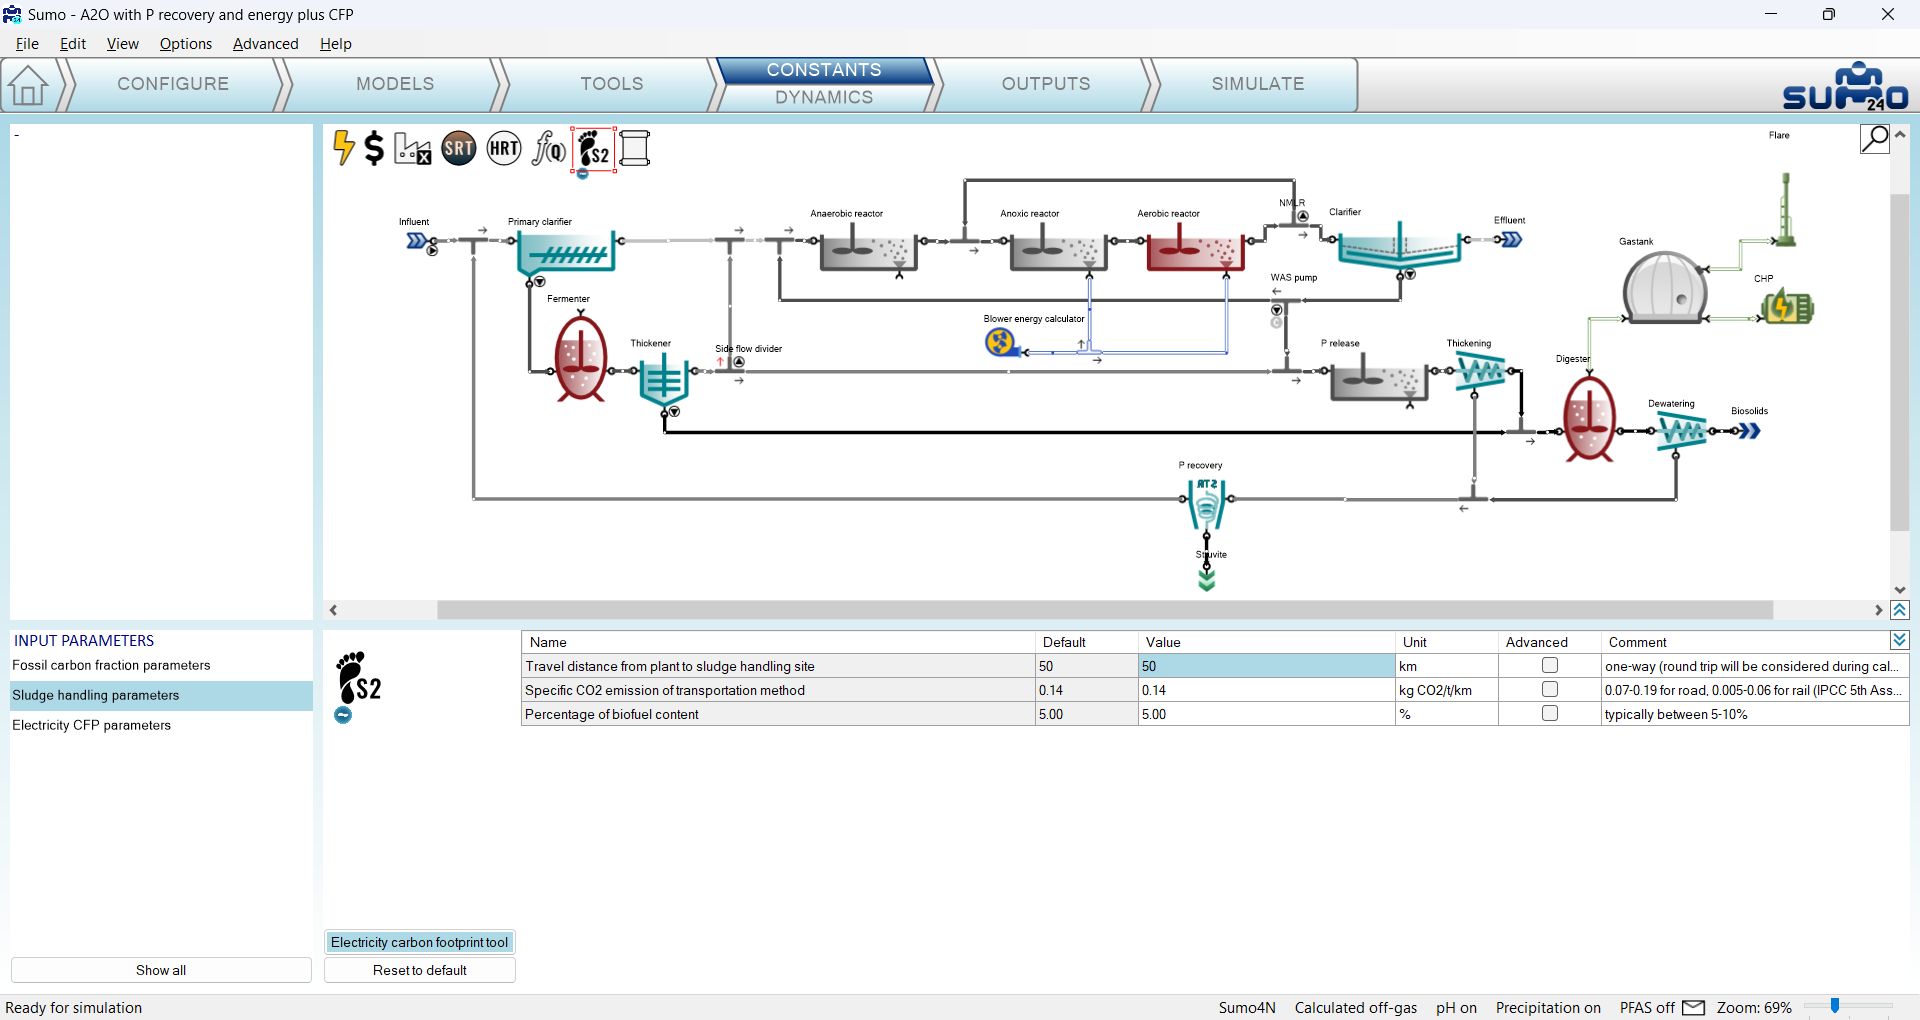
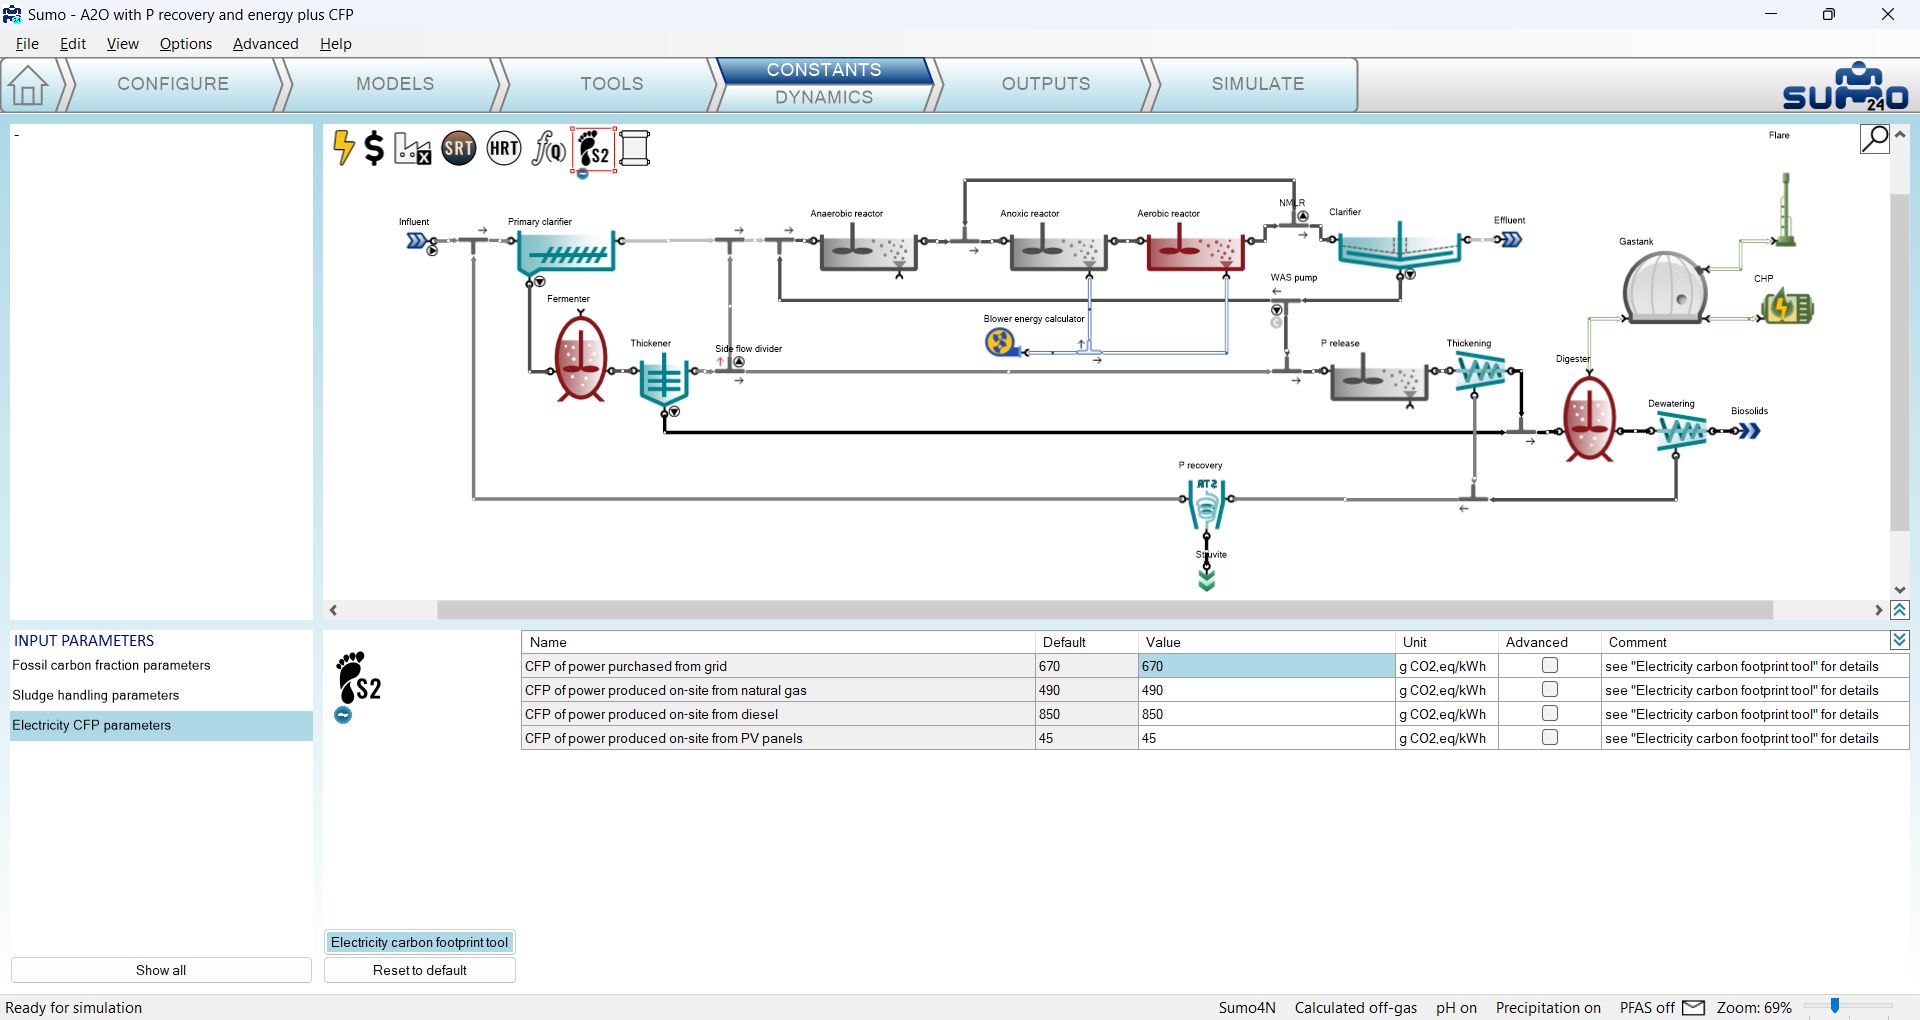
Moving over to the Inputs tab, the general input CFP parameters will appear. In the first table the Fossil carbon fractions can be specified (Figure 6.2.2). The second table contains the Sludge handling parameters (these depend on the previous choice of sludge handling method, see Figure 6.2.3). The third table contains the set of Electricity CFP parameters, which are used in conjunction with the Energy mode settings, enabling on-site and off-site power production methods (Figure 6.2.4). The latter table becomes active only when the Energy mode is turned on (enabling Scope 2 CFP calculations), like in this example project.
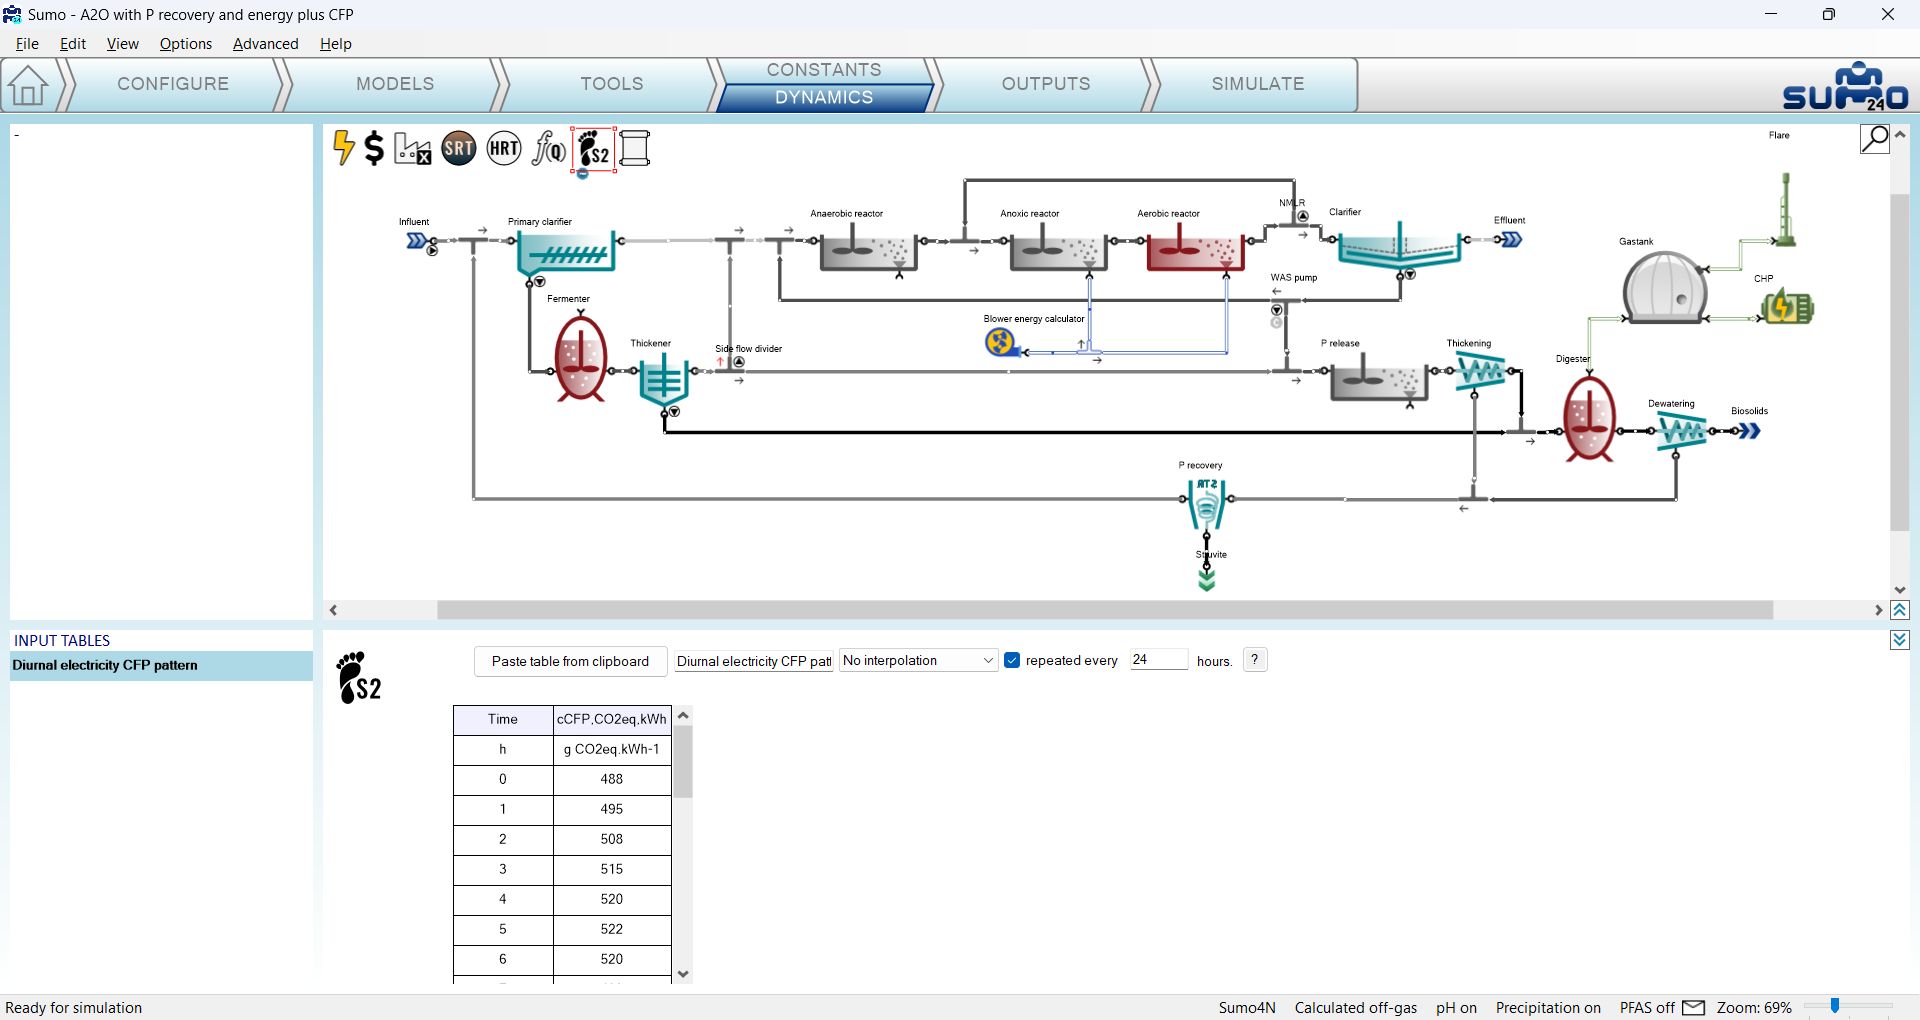
Below the parameter tables you can find a button for opening the ‘Electricity carbon footprint tool’, the database that is aimed to help determining correct grid and off-grid power CFP values, based on available regional and technology specific data. The example project uses one of the diurnal grid power CFP patterns from this tool (you can check it out by clicking on the Constants/Dynamics tab, see Figure 6.2.5).
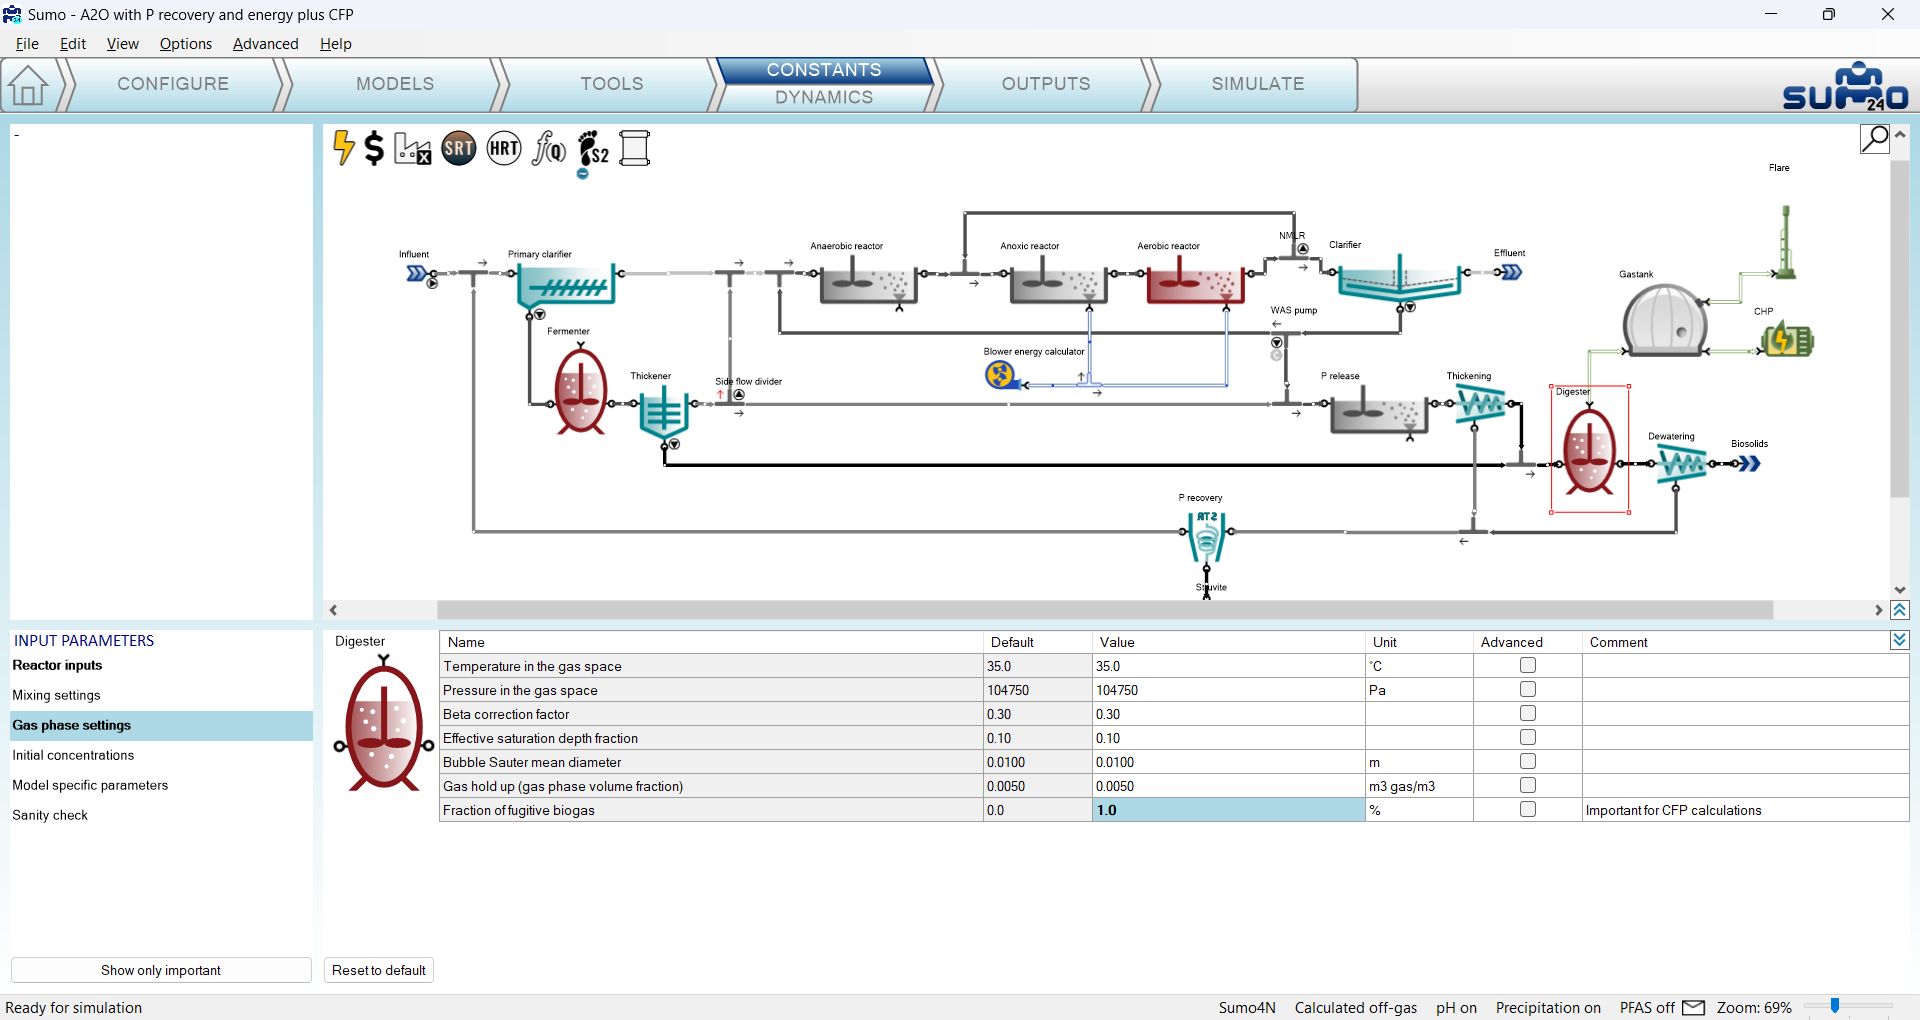
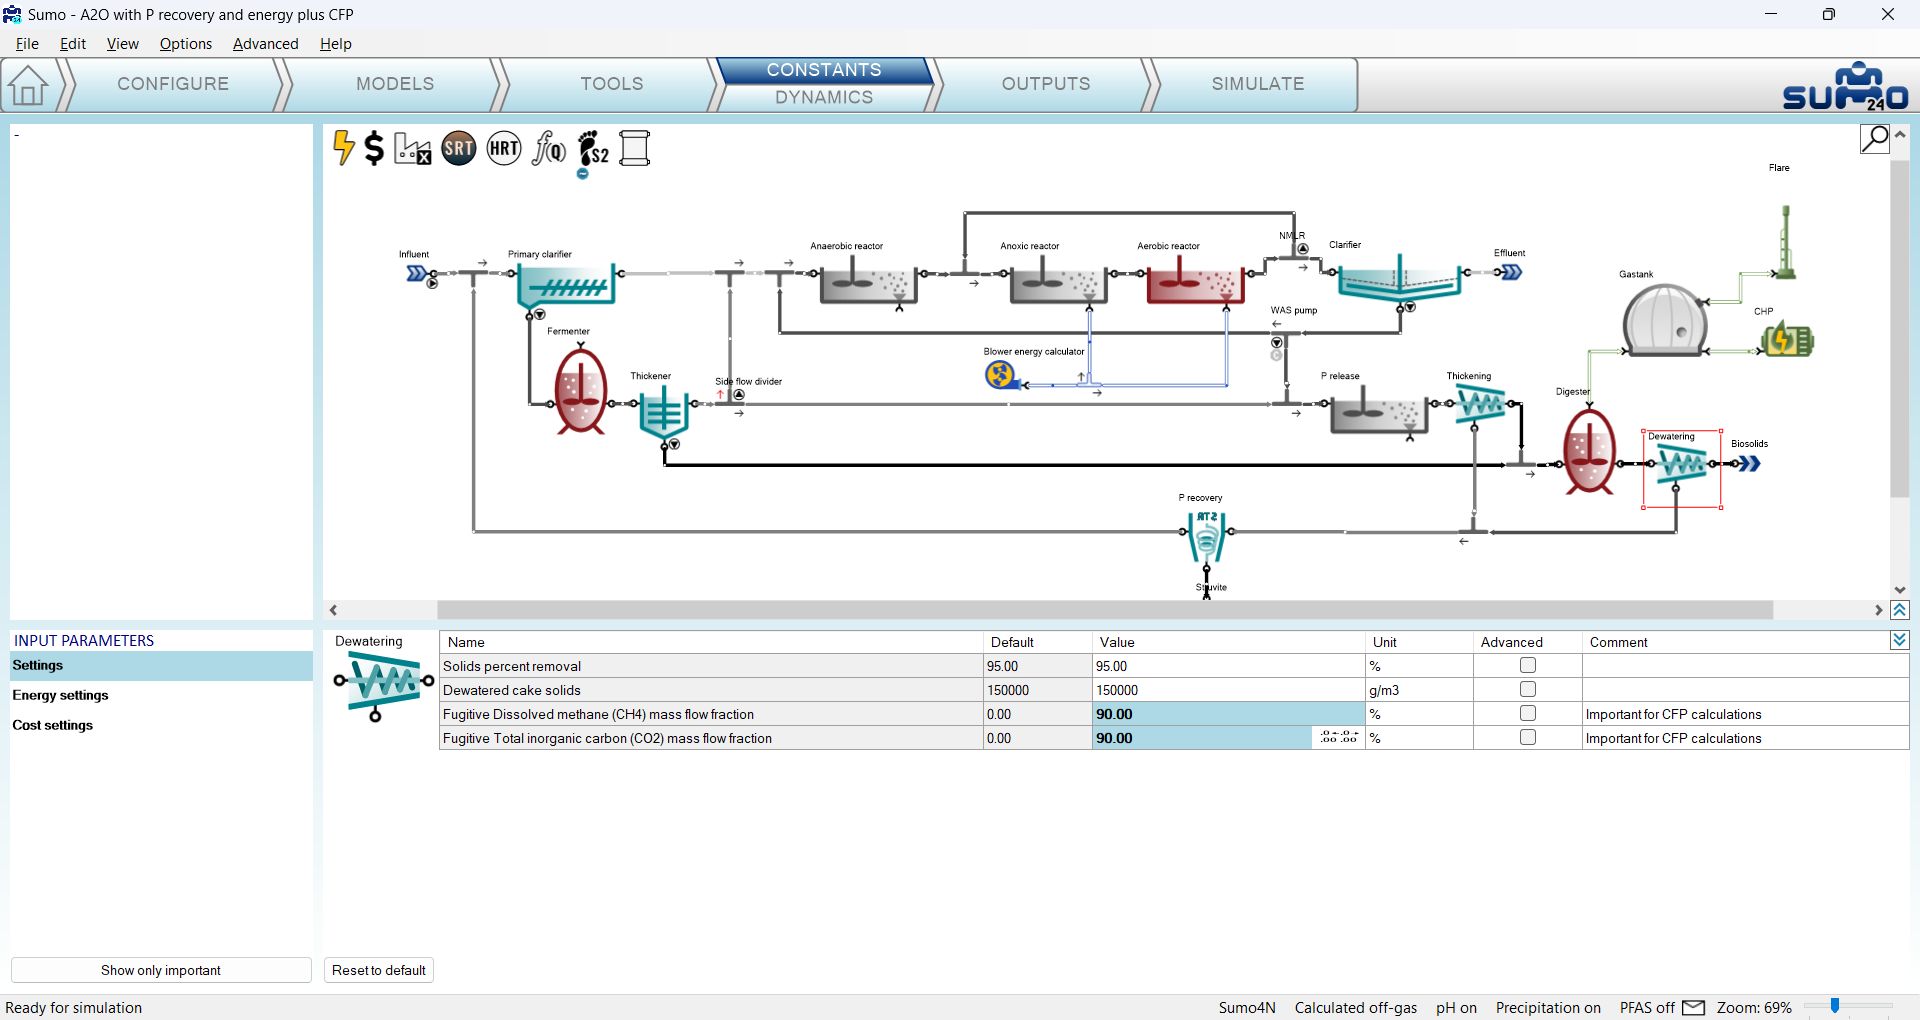
In order to assess all process-related CFP, new parameters have been added to the Digester and Dewatering process units. While on the Inputs/Constants tab, select the Digester on the drawing board and click the Show all button in the bottom left panel, then select the Gas phase settings table. You will find here the Fraction of fugitive biogas parameter, which has been modified in the example project from the default 0 to 1% (Figure 6.2.6). Similarly, when selecting the Dewatering unit, in the Settings table you will find parameters to adjust the fugitive mass flow fractions of methane and carbon dioxide (Figure 6.2.7). These parameters allow for estimating the effect of assumed (hard-to-measure in real life) losses and evaluate various scenarios.
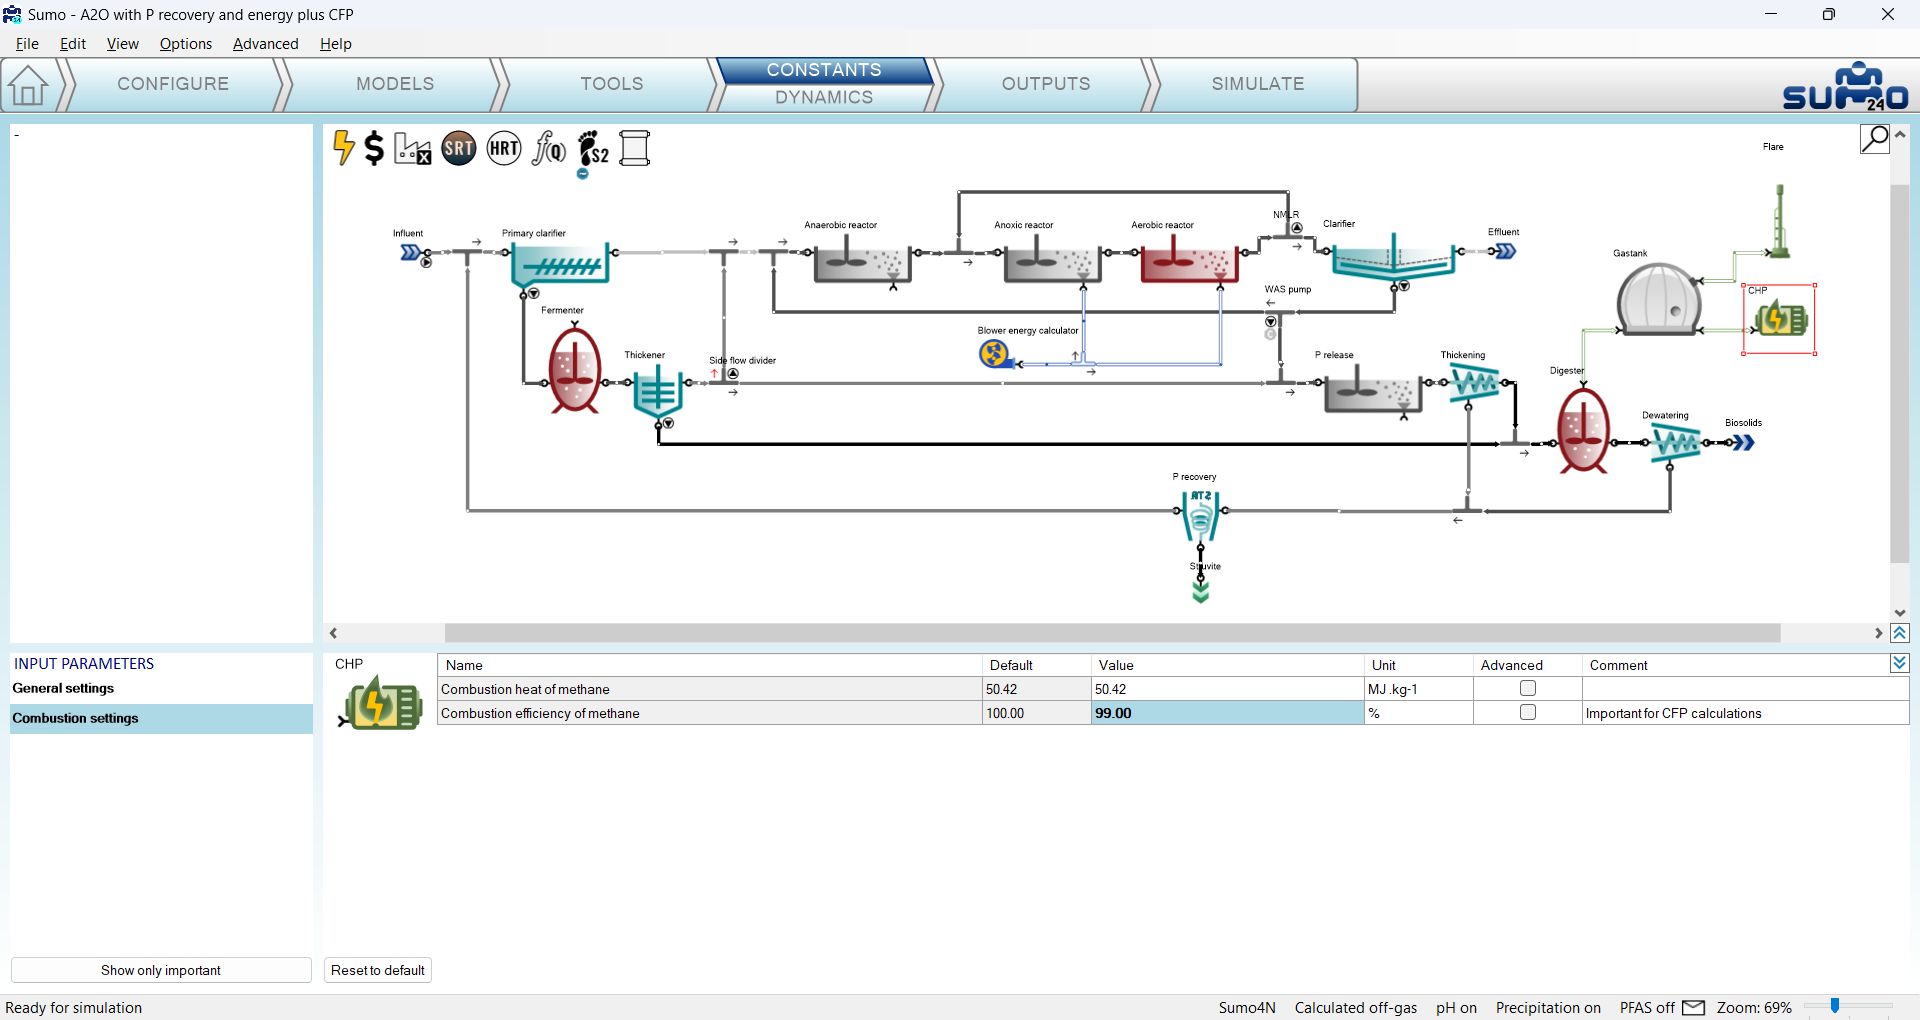
When Scope 2 CFP is enabled (Energy mode is active) and biogas processing is considered in the layout, it is also important to set the Combustion efficiency of methane parameter (available from the Combustion settings parameter table) in both the CHP and Flare process units (Figure 6.2.8). The value of this parameter is usually somewhere between 99% and 100%, which may seem indifferent, however, even such a little change in GHG emissions originating from incomplete combustion can make up a visible portion of the overall CFP.
¶ Outputs
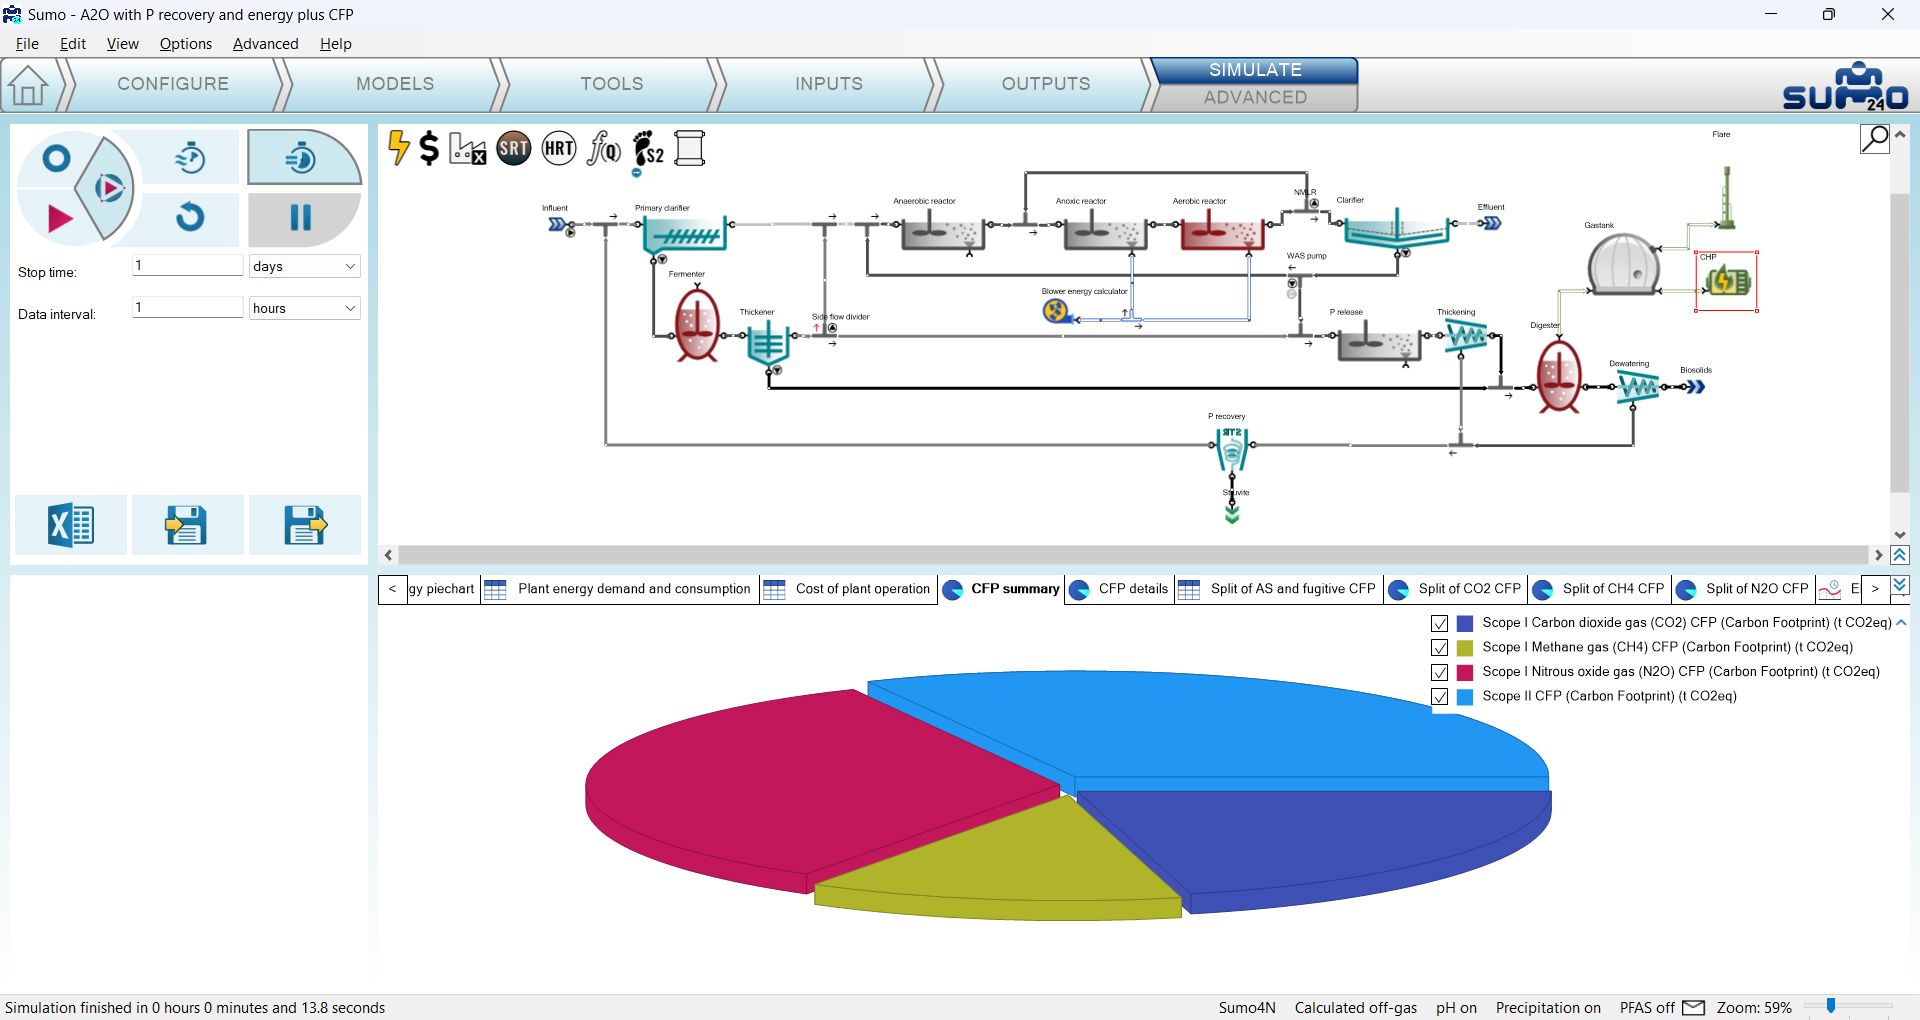
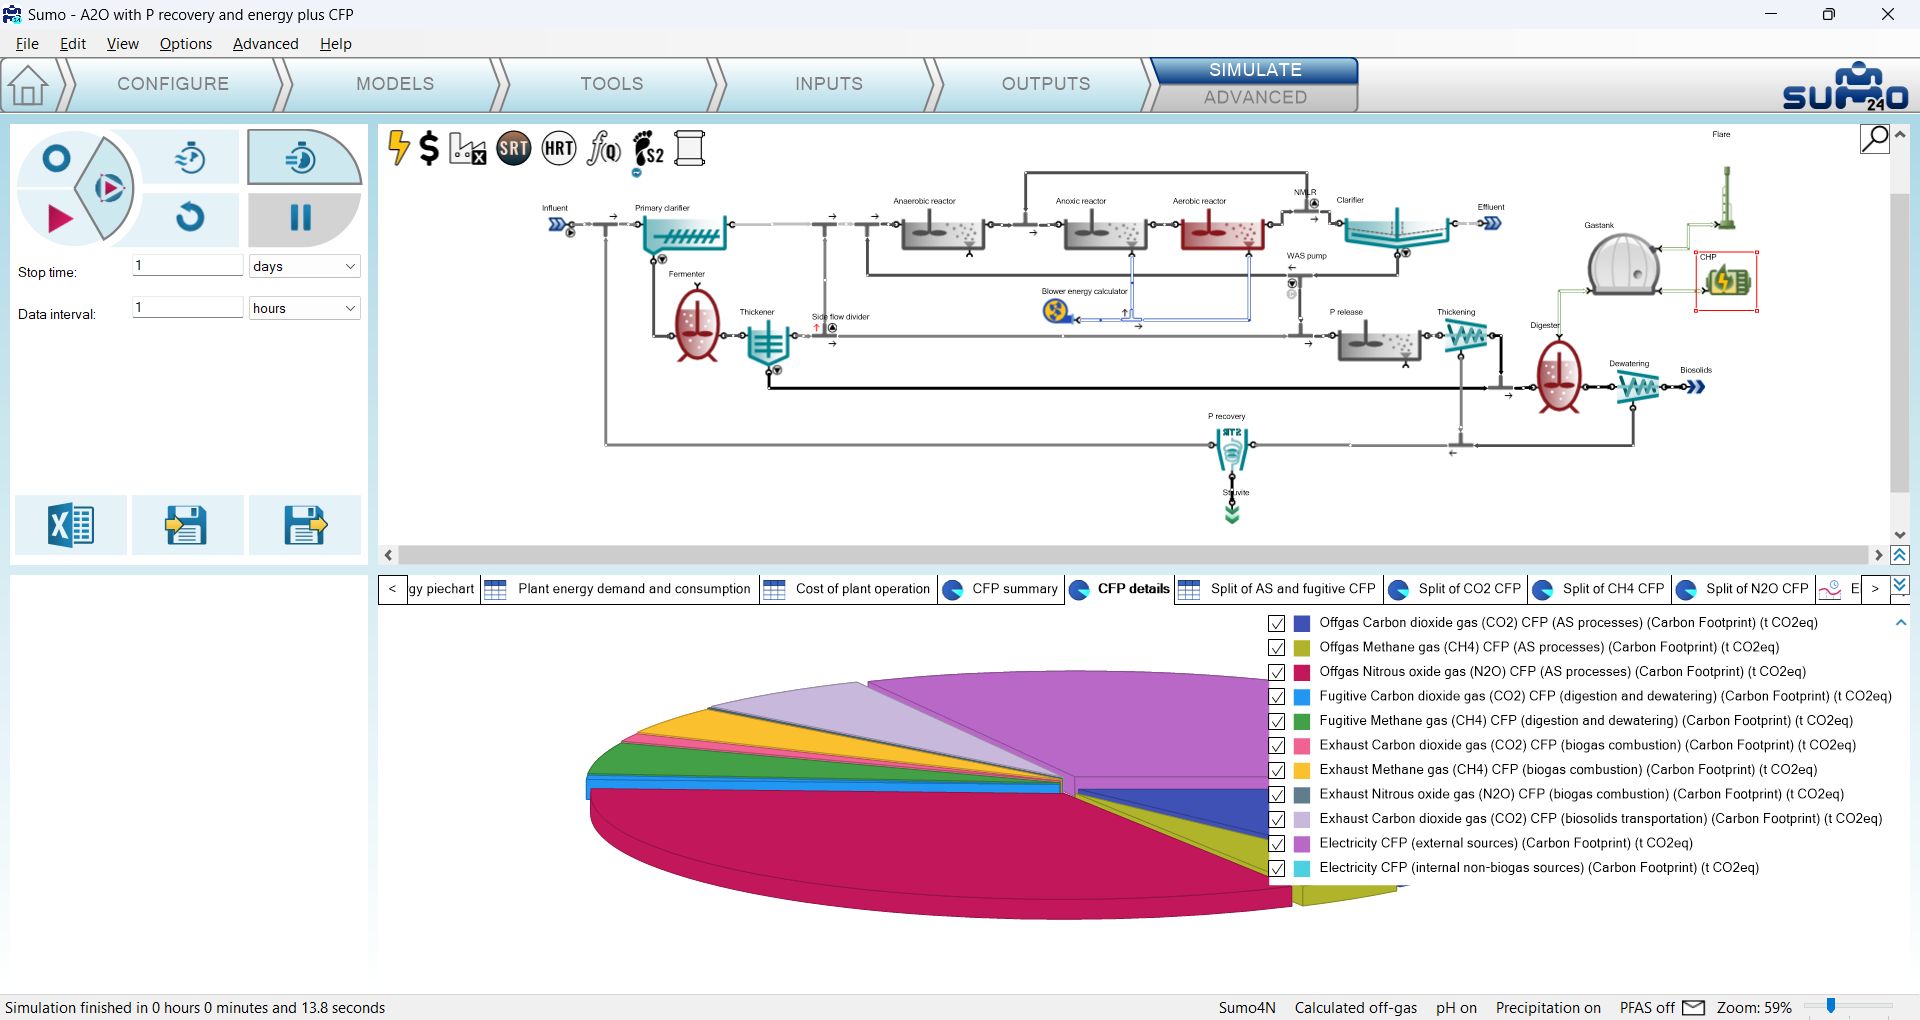
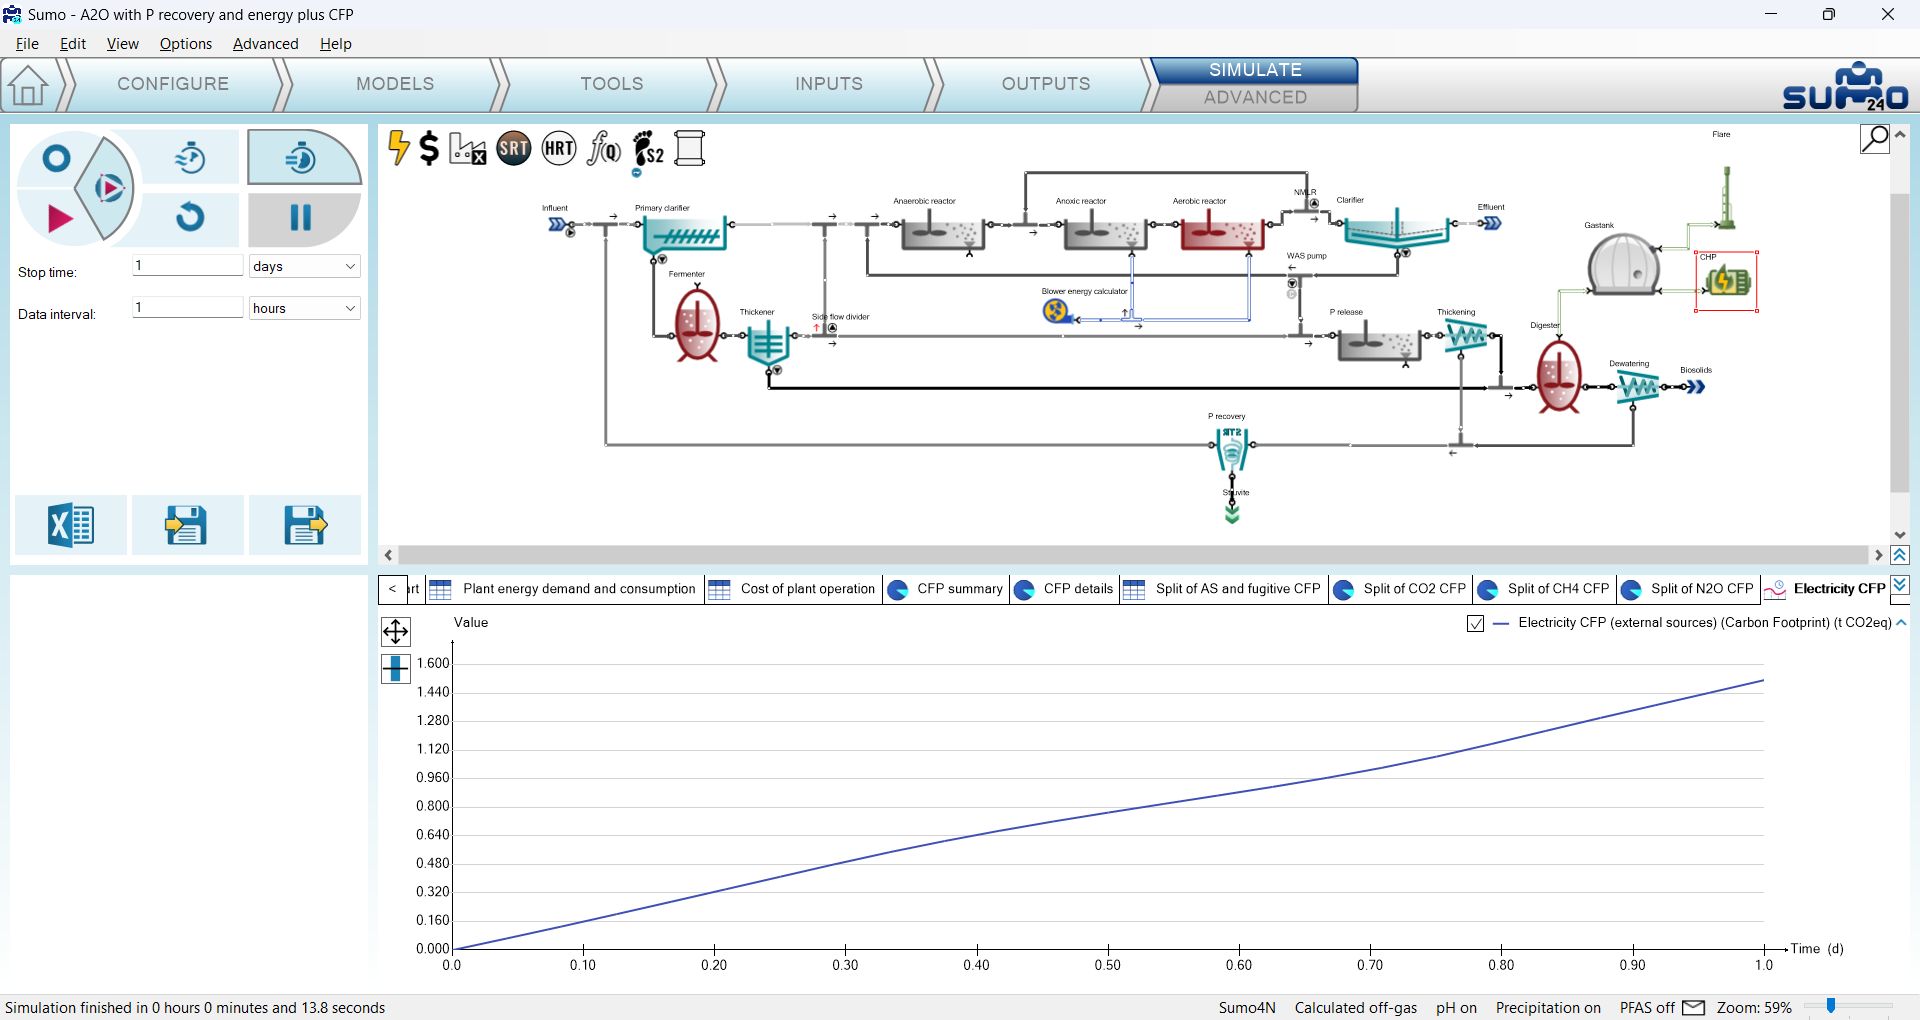
Results of the CFP assessment can be visualized by selecting the Carbon footprint icon on the Outputs tab and choosing from the prepared variable groups, such as ‘CFP summary’ or more detailed splits of direct and indirect CFP components, as well as CFP component splits focusing on the individual GHGs. Direct and indirect emission rates of GHGs are also available. To get some inspiration on how to use these data, proceed to the Simulate tab and launch a 1-day dynamic run from steady state, then review the outputs from the ‘CFP summary’ piechart to the ‘Electricity CFP’ timechart.
From the ‘CFP summary’ (Figure 6.2.9) one can see that about two-thirds of the plant operation CFP for the simulated period comes from power usage, while the rest is about equally distributed between various process-related emissions of the three GHGs. Looking deeper, it turns out that about half of the overall plant operation CFP originates from the activated sludge process, while fugitive losses and incomplete biogas combustion, along with sludge handling (transportation to external handling site in this case) are smaller, yet visible fractions (Figure 6.2.10). The diurnal variability of electricity CFP is also visible but not outstanding (Figure 6.2.11).
Please note that CFP is a figure calculated from the time-integral of emission rates, and therefore it is available for dynamic simulations only (steady-state simulations will not result any CFP value).
¶ Next chapters
Chapter 7 – Design model
Chapter 8 – Examples