¶ Overview
In this chapter, the built-in example configurations are presented covering various process technologies. These examples can be selected from the bottom right window pane of the Welcome Screen, organized on a series of tabs, according to the featured topic. The project files are located in the install directory.
¶ Tutorial plants
¶ Hydraulic SRT
This plant is a demonstration of hydraulic SRT control. The wastage is removed from the reactor itself, and SRT (irrespective of the MLSS content) will be V/QWAS. Since the reactor volume is 10,000 m3, 3000 m3/d wastage will result in 3.3 d of SRT and loss of nitrification at 12°C.

¶ Tutorial plant
This is the example layout used in this manual.

¶ Tutorial plant 2
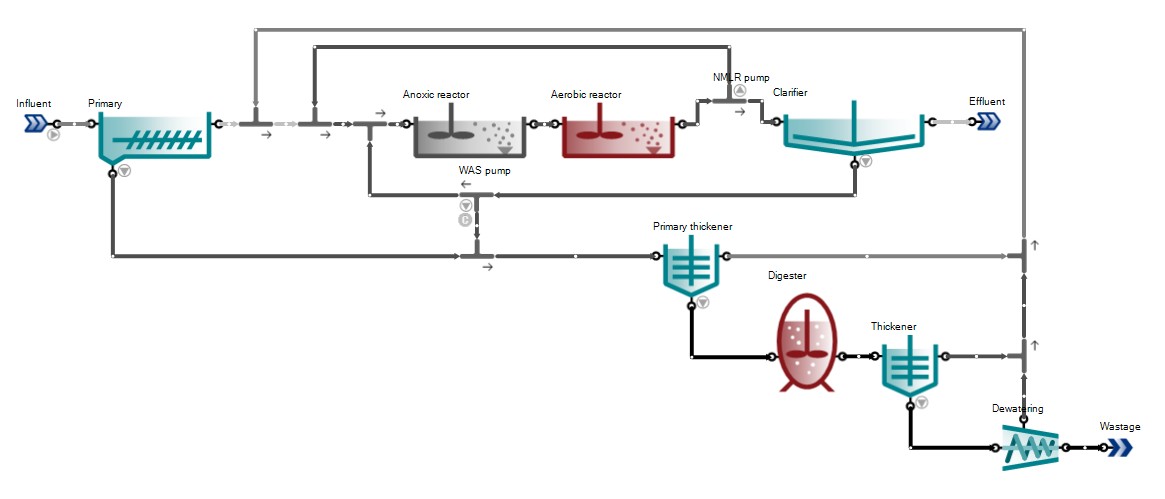
Tutorial Plant 2 is the extended configuration of Tutorial plant, including mesophilic digestion. Off-gas and pH calculations are turned on.
¶ Tutorial plant 2 with energy
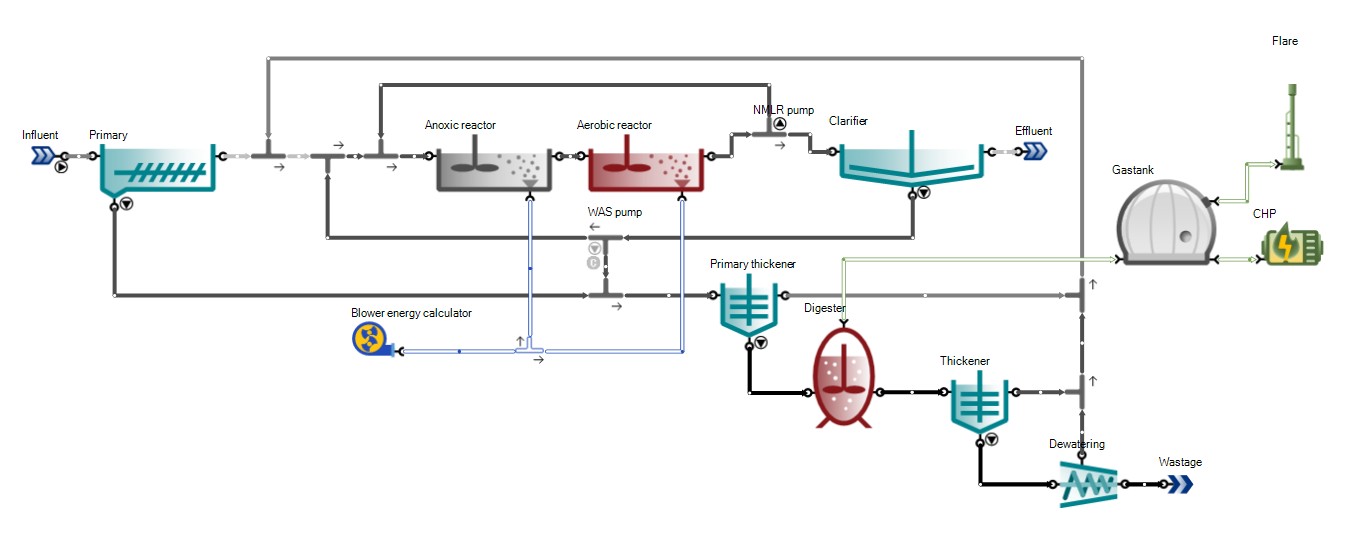
Tutorial Plant 2 with energy calculations turned on.
¶ Tutorial plant 3
Tutorial plant 3 is the extended version of Tutorial plant 2 with sidestream treatment (nitritation and denitritation). This configuration is simulated using the two-step nitrification/denitrification model with Sulfur (Sumo2S). Off-gas, pH and precipitation calculations are turned on.

¶ Tutorial plant 4
Tutorial plant 4 is the extended version of Tutorial plant 2 with a different sidestream treatment (partial nitritation and anammox). This configuration is simulated using the two-step nitrification/denitrification model. Off-gas, pH and precipitation calculations are turned on.

¶ Nutrient removal
¶ A2O plant
A2O configuration with one-step nitrification/denitrification model.

¶ A2O with P recovery and energy
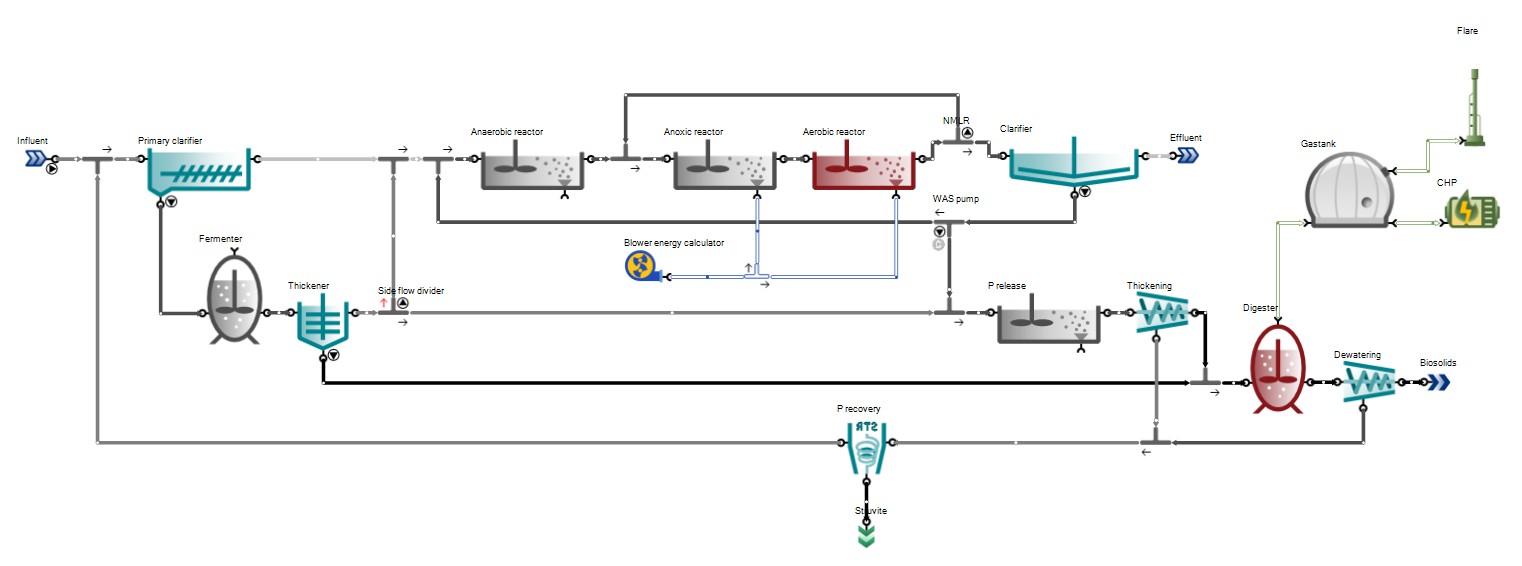
This layout is the extended version of the A2O configuration with primary sludge fermentation, digestion and P recovery (struvite precipitation). Off-gas, pH and precipitation calculations, as well as energy calculations, are turned on.
¶ A2O with P recovery and energy plus CFP
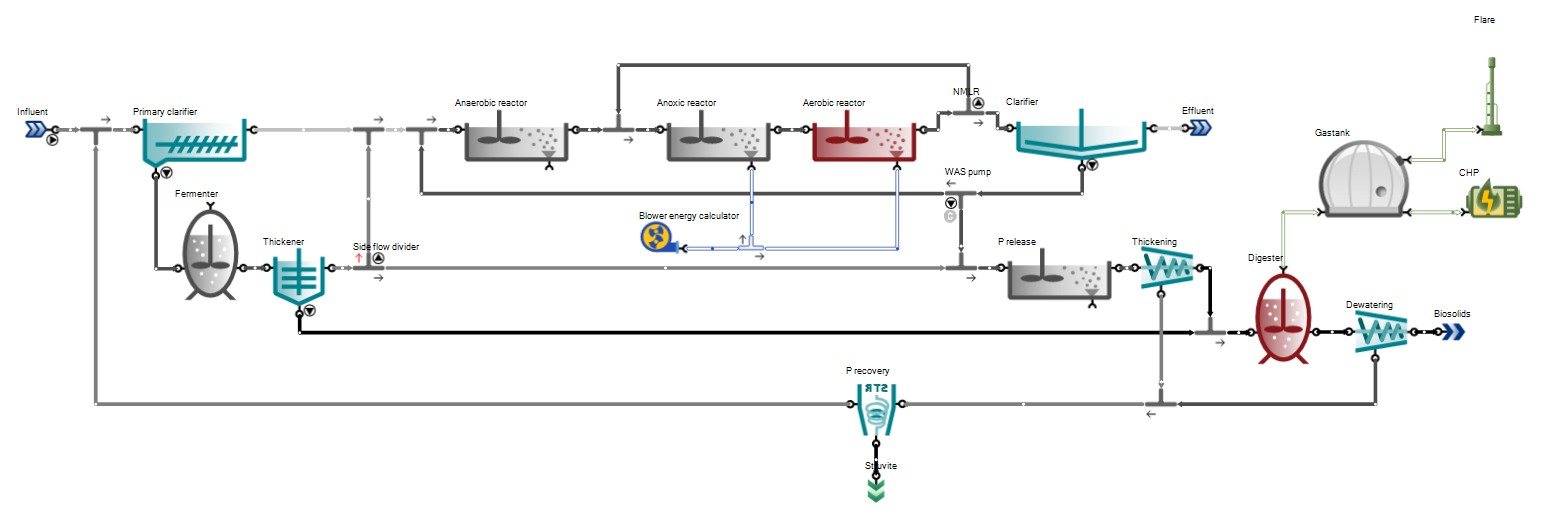
This layout is the same as the previous configuration, extended with carbon footprint (CFP) calculations. For the sake of CFP assessment, the underlying process model is changed to Sumo4N in order to improve accounting for nitrous oxide (a very powerful greenhouse gas) production.
¶ Bardenpho
Five-stage Bardenpho configuration with one-step nitrification/denitrification model.

¶ Johannesburg
RAS fermentation Bio-P plant.

¶ MLE configuration
Modified Ludzack-Ettinger configuration with one-step nitrification/denitrification.

¶ MLE with 2-point iron chloride dosage
MLE configuration with chemical P-removal.

¶ MLE with denite filter

¶ MLE with energy
This layout is the MLE configuration extended with energy calculations.

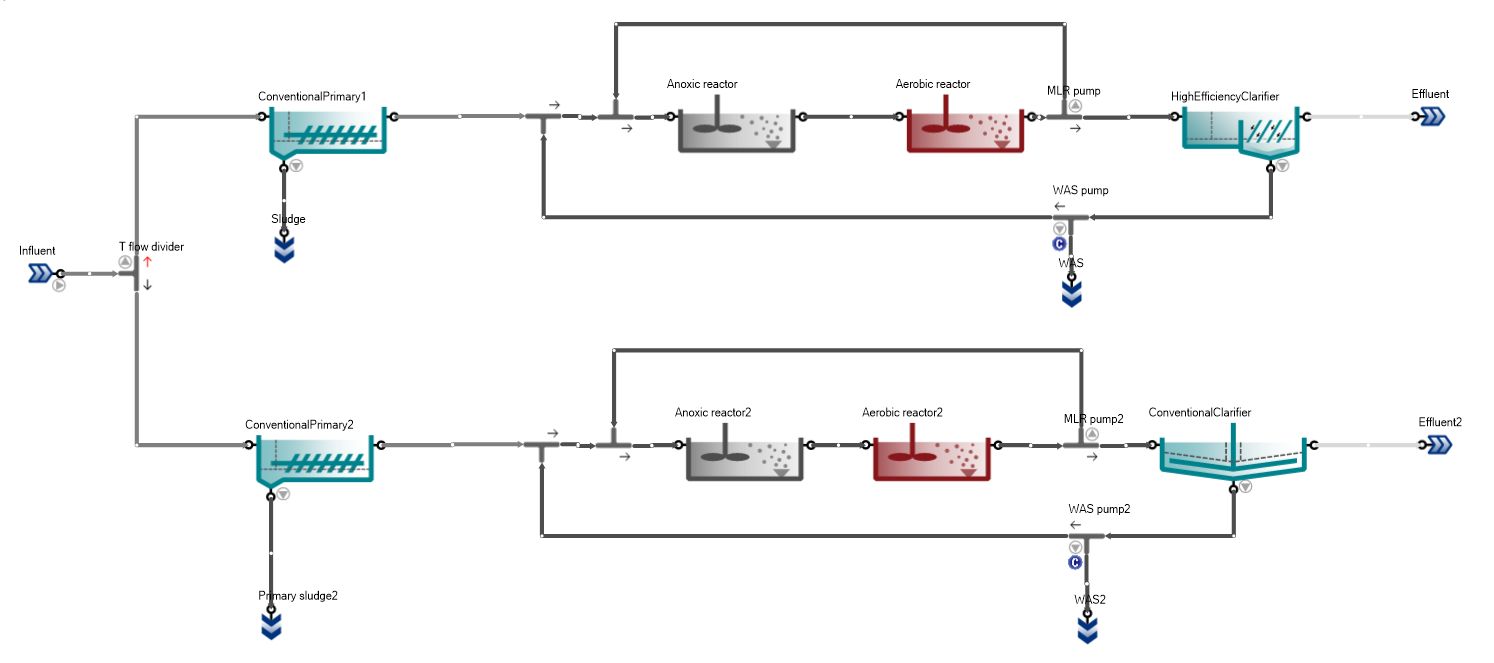
¶ MLE with high efficiency clarifier
¶ MLE with MBR and chemical P removal
This layout is the extended version of the MLE configuration with chemical P removal, using aerated membrane bioreactor as phase separator.

¶ Modified UCT
This layout is a Bio-P plant using the modfied University of Cape Town arrangement.

¶ Biofilm
¶ BAF plant
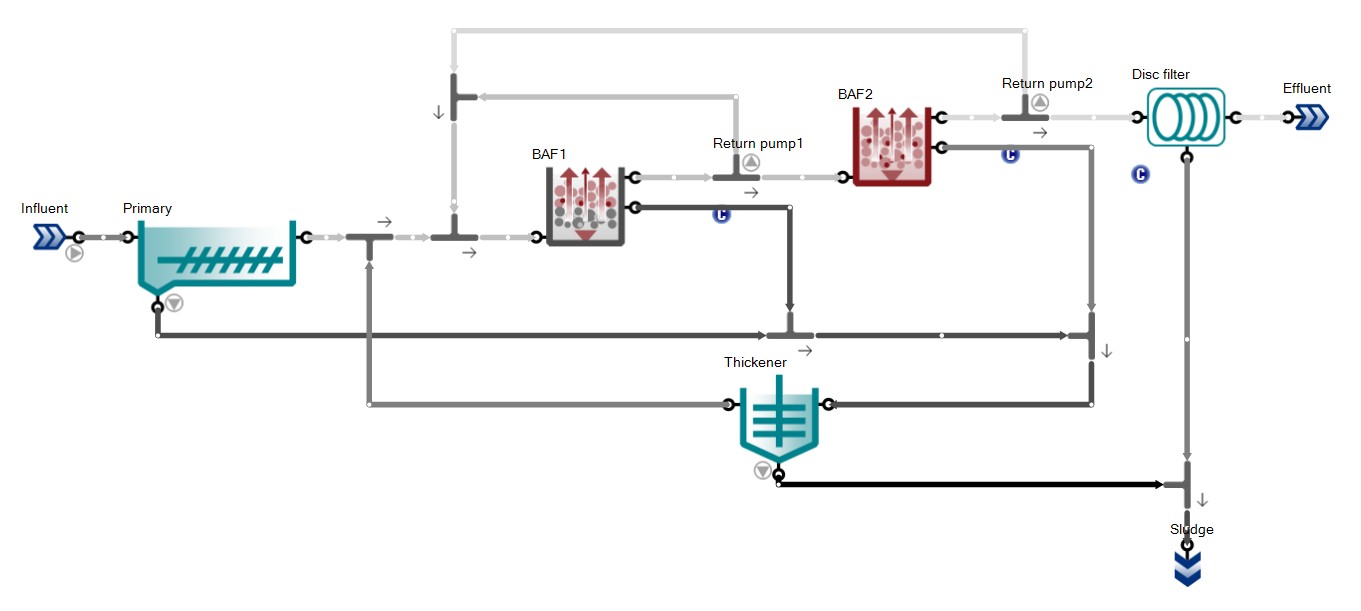
This layout features a treatment plant configuration employing upflow biological aerated filters.
¶ MLE with MBBR
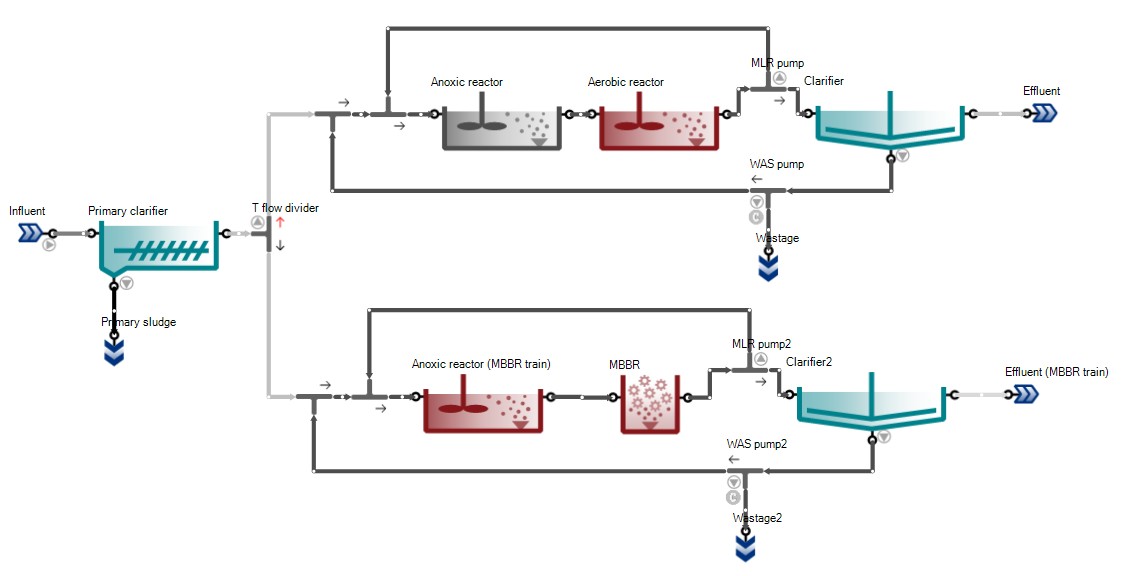
This layout has two parallel MLE trains with wintertime influent to demonstrate the benefits of upgrading the aerobic reactor with media for enhanced N removal.
¶ Trickling filter configuration
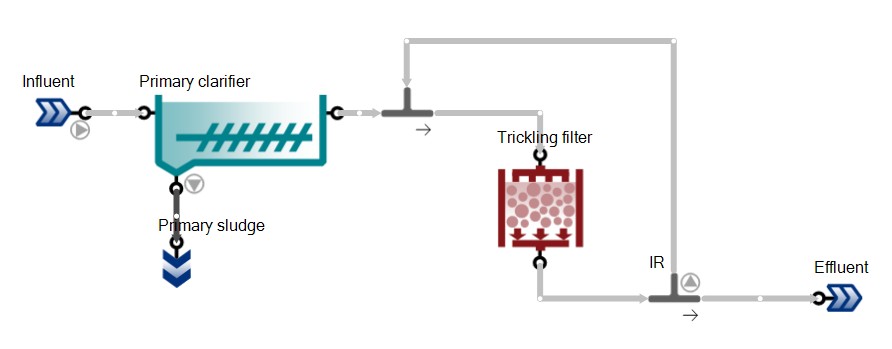
Simple trickling filter plant example with biofilm model.
¶ SBR
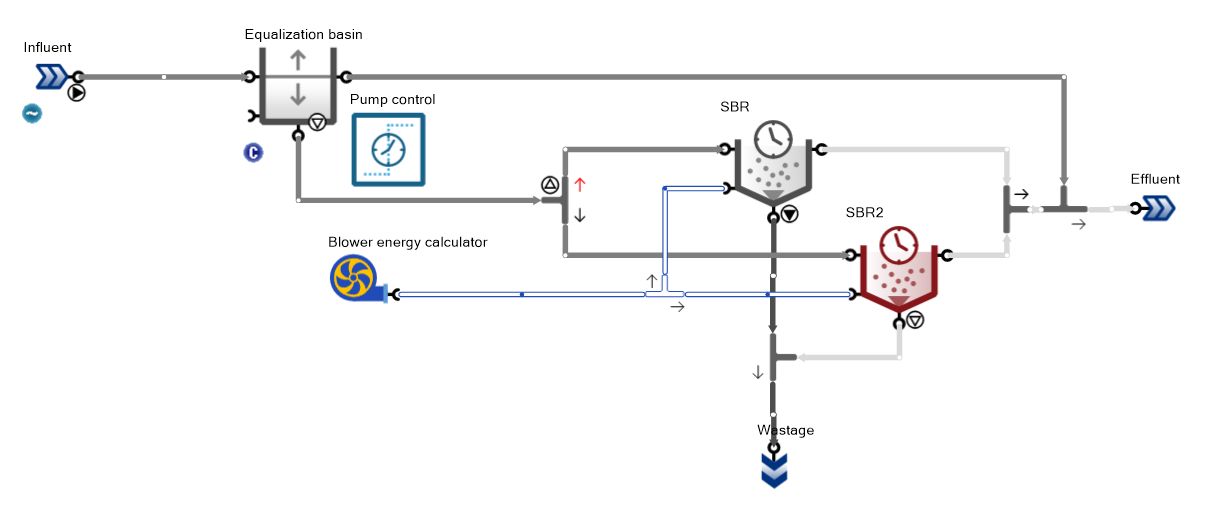
¶ Flexible 2 SBR plant with energy plus CFP
¶ SBR plant
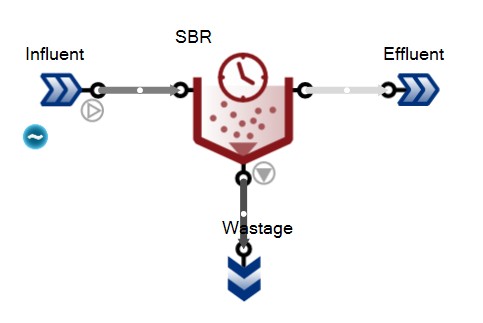
Sequencing batch reactor example with one-step nitrification/denitrification.
¶ Nature-based
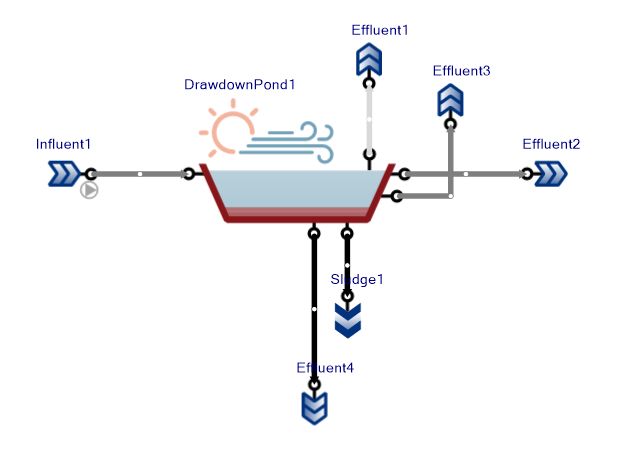
¶ Drawdown pond
¶ Three drawdown ponds

¶ Three lagoons in series
This example demonstrates the long-term behavior of aerated facultative lagoons.

¶ Two ponds with algae
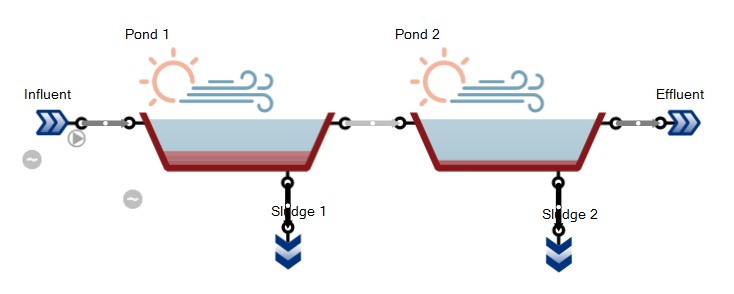
This example demonstrates the long-term behavior of unaerated ponds relying solely on algae and natural surface aeration.
¶ Controllers
¶ Cascade controller
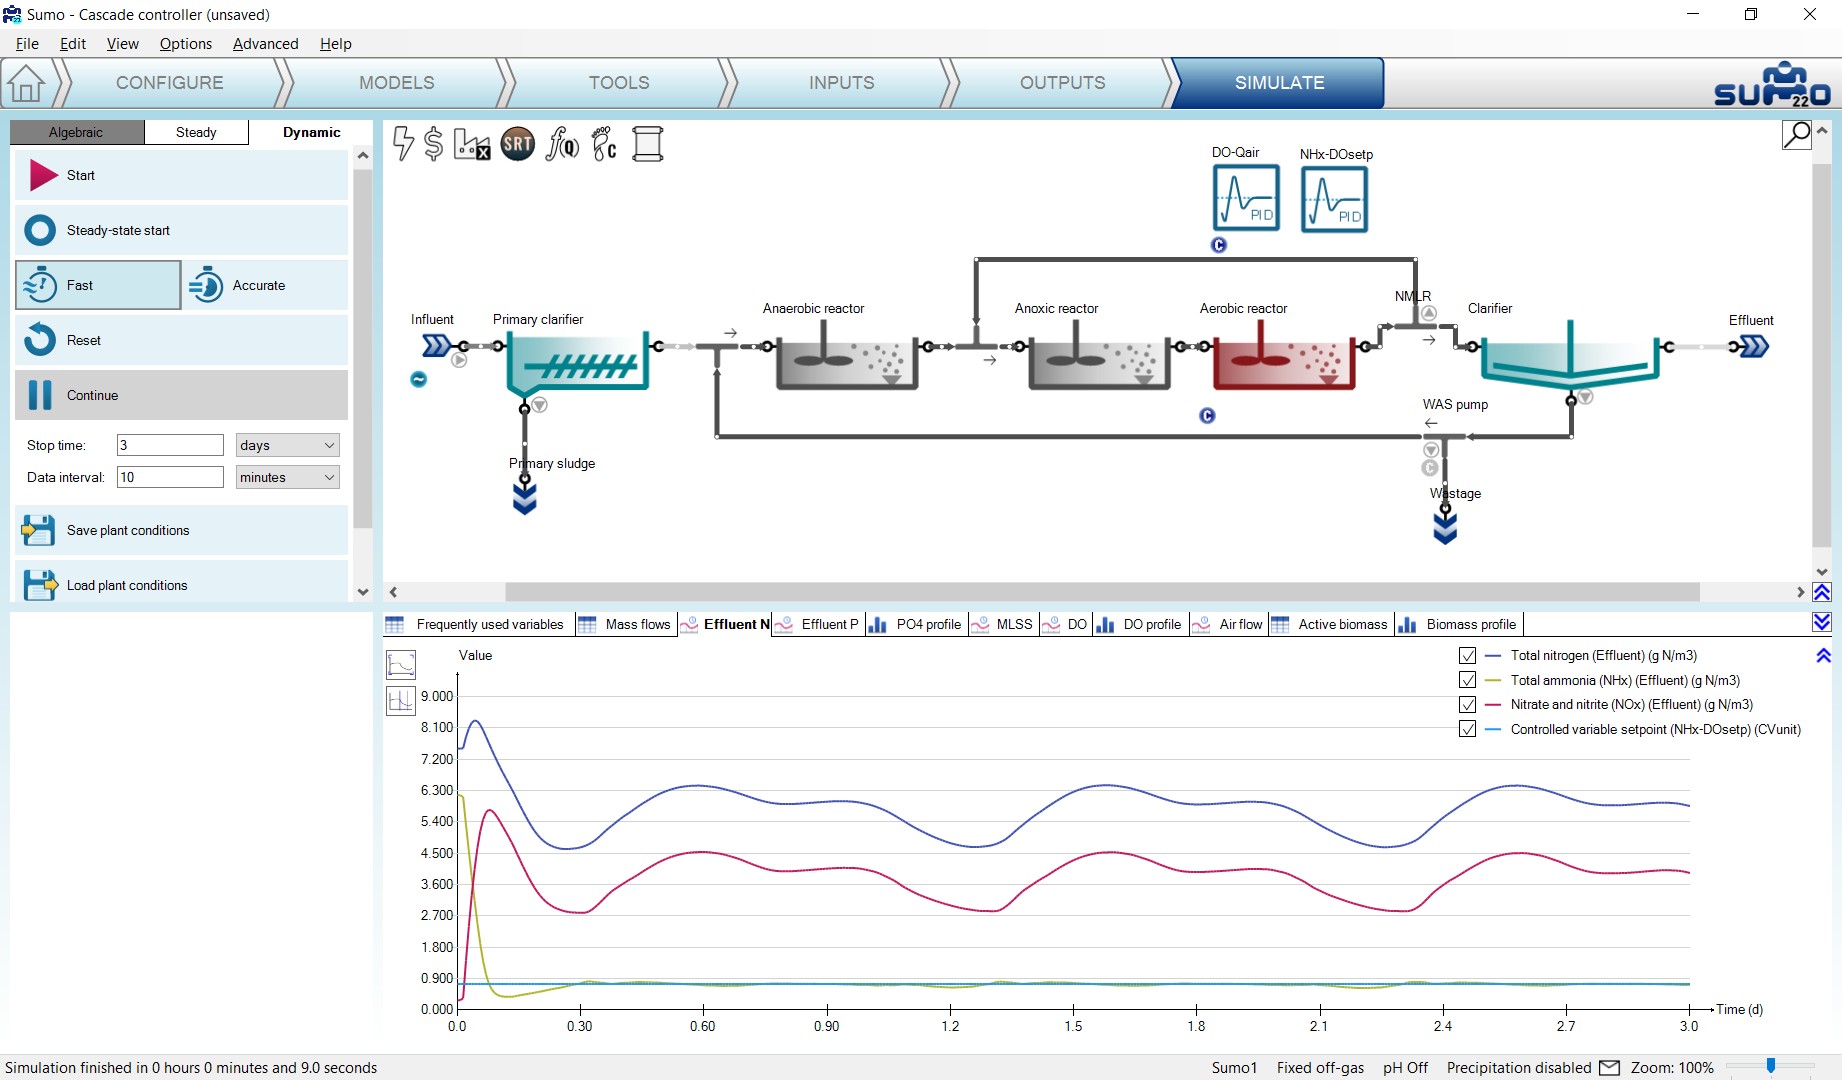
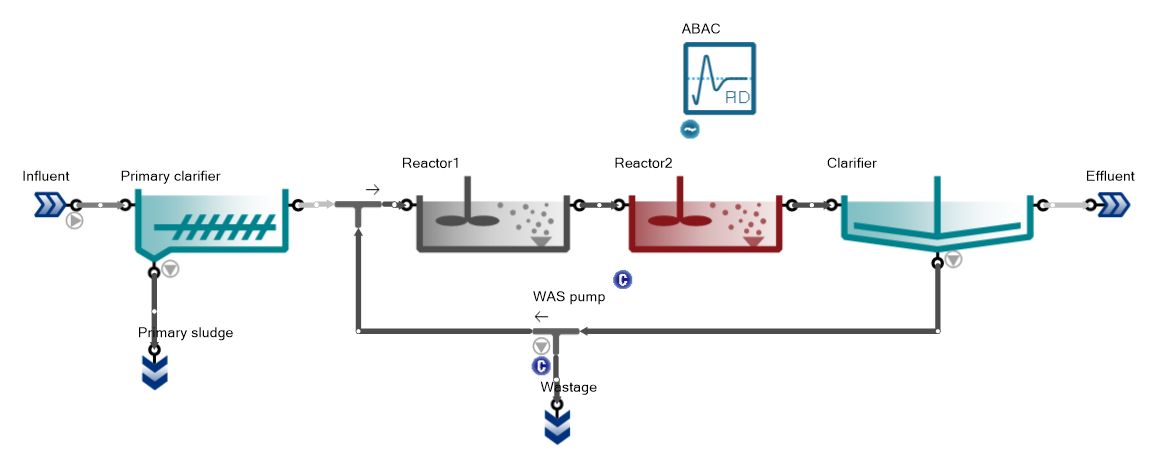
This example demonstrates the application of the cascade controller strategy for ammonia-based aeration control (ABAC) using two PID controllers (Figure 8.6.1).
¶ DO and MLSS control
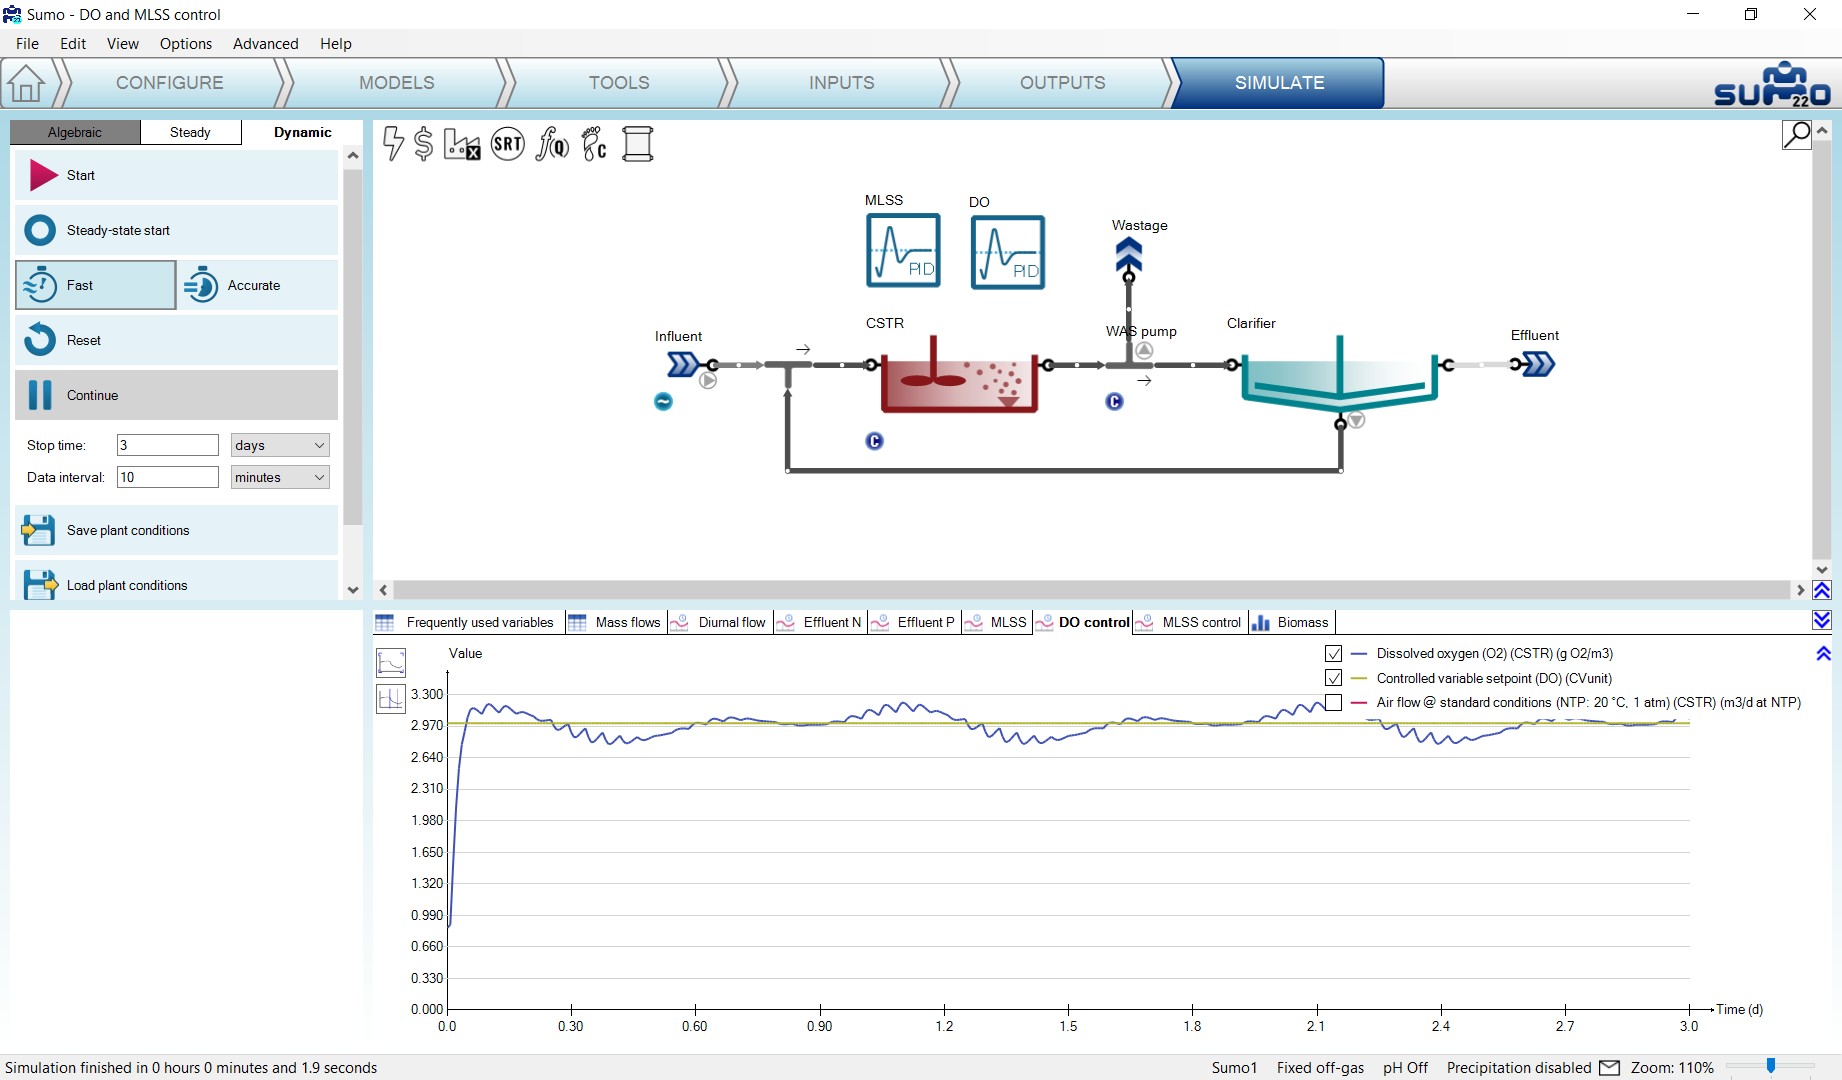
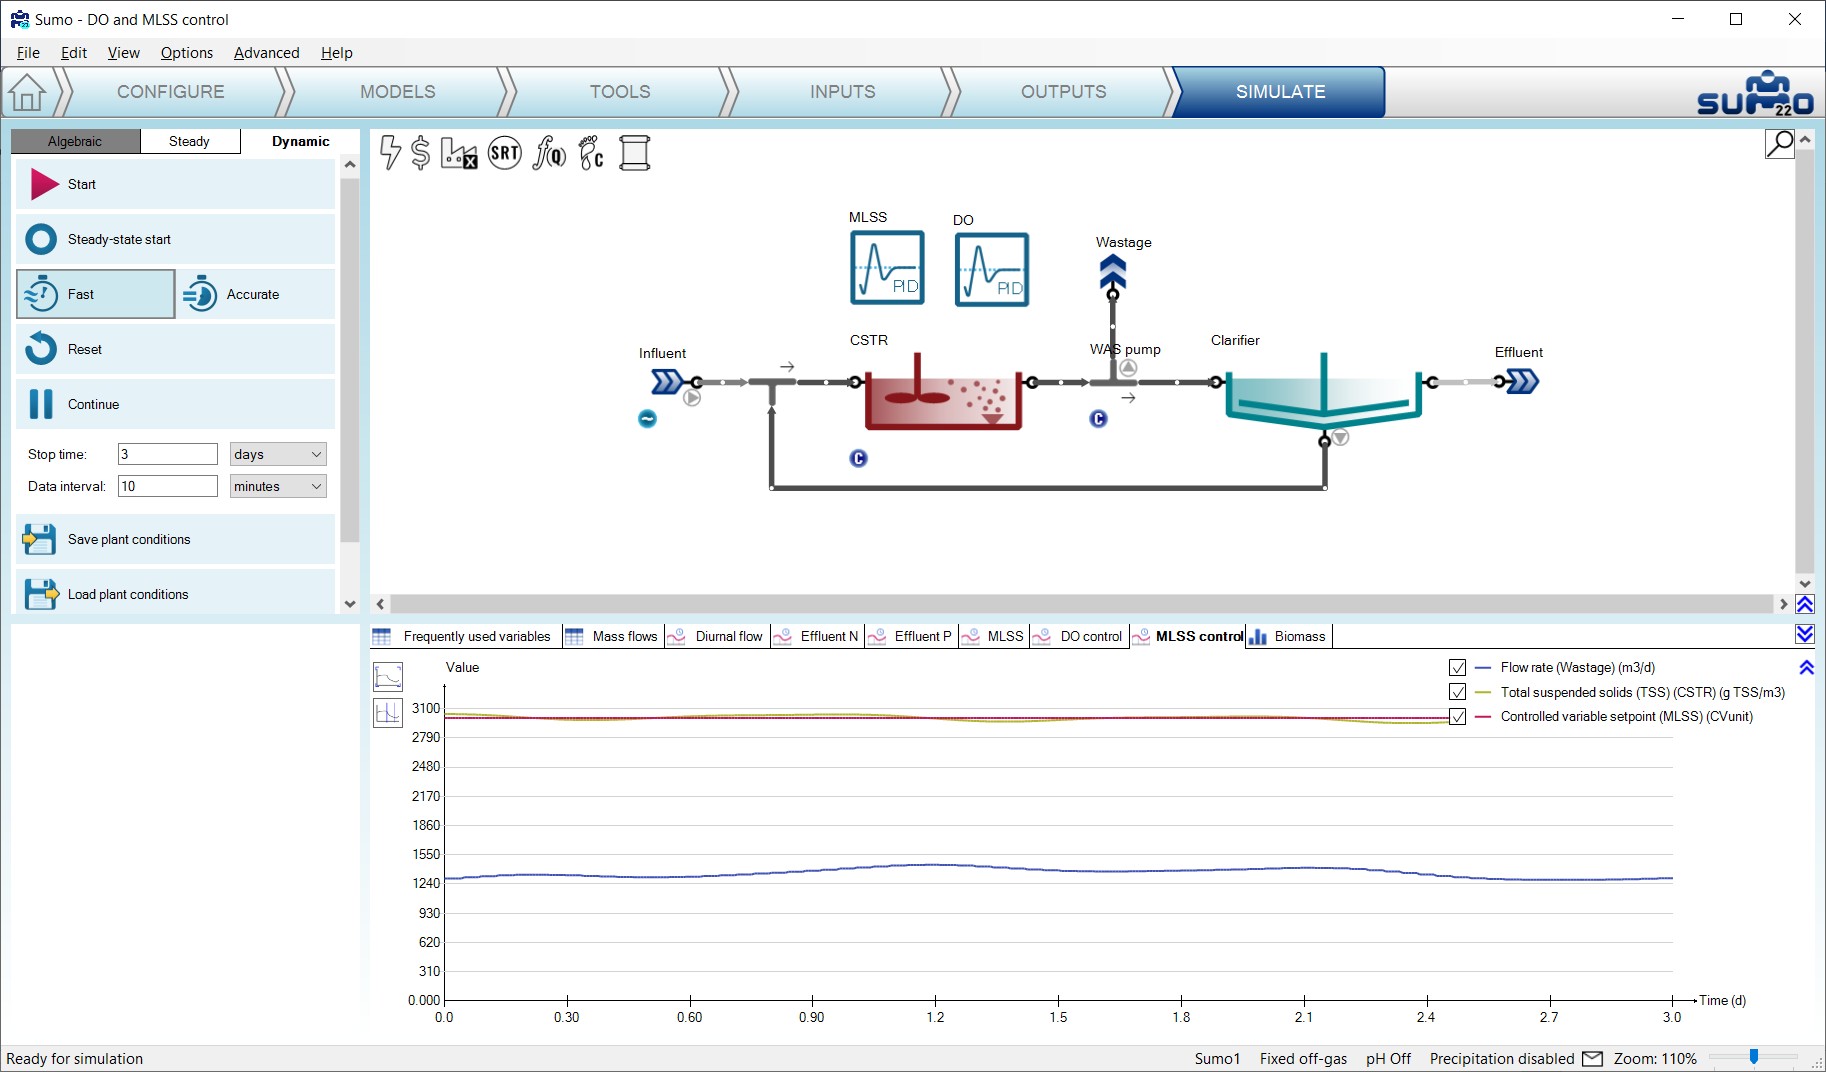
This example demonstrates the implementation of parallel control strategy for MLSS and DO, relying on two PID controllers (Figure 8.6.2 and Figure 8.6.3).
¶ Optimal TN control
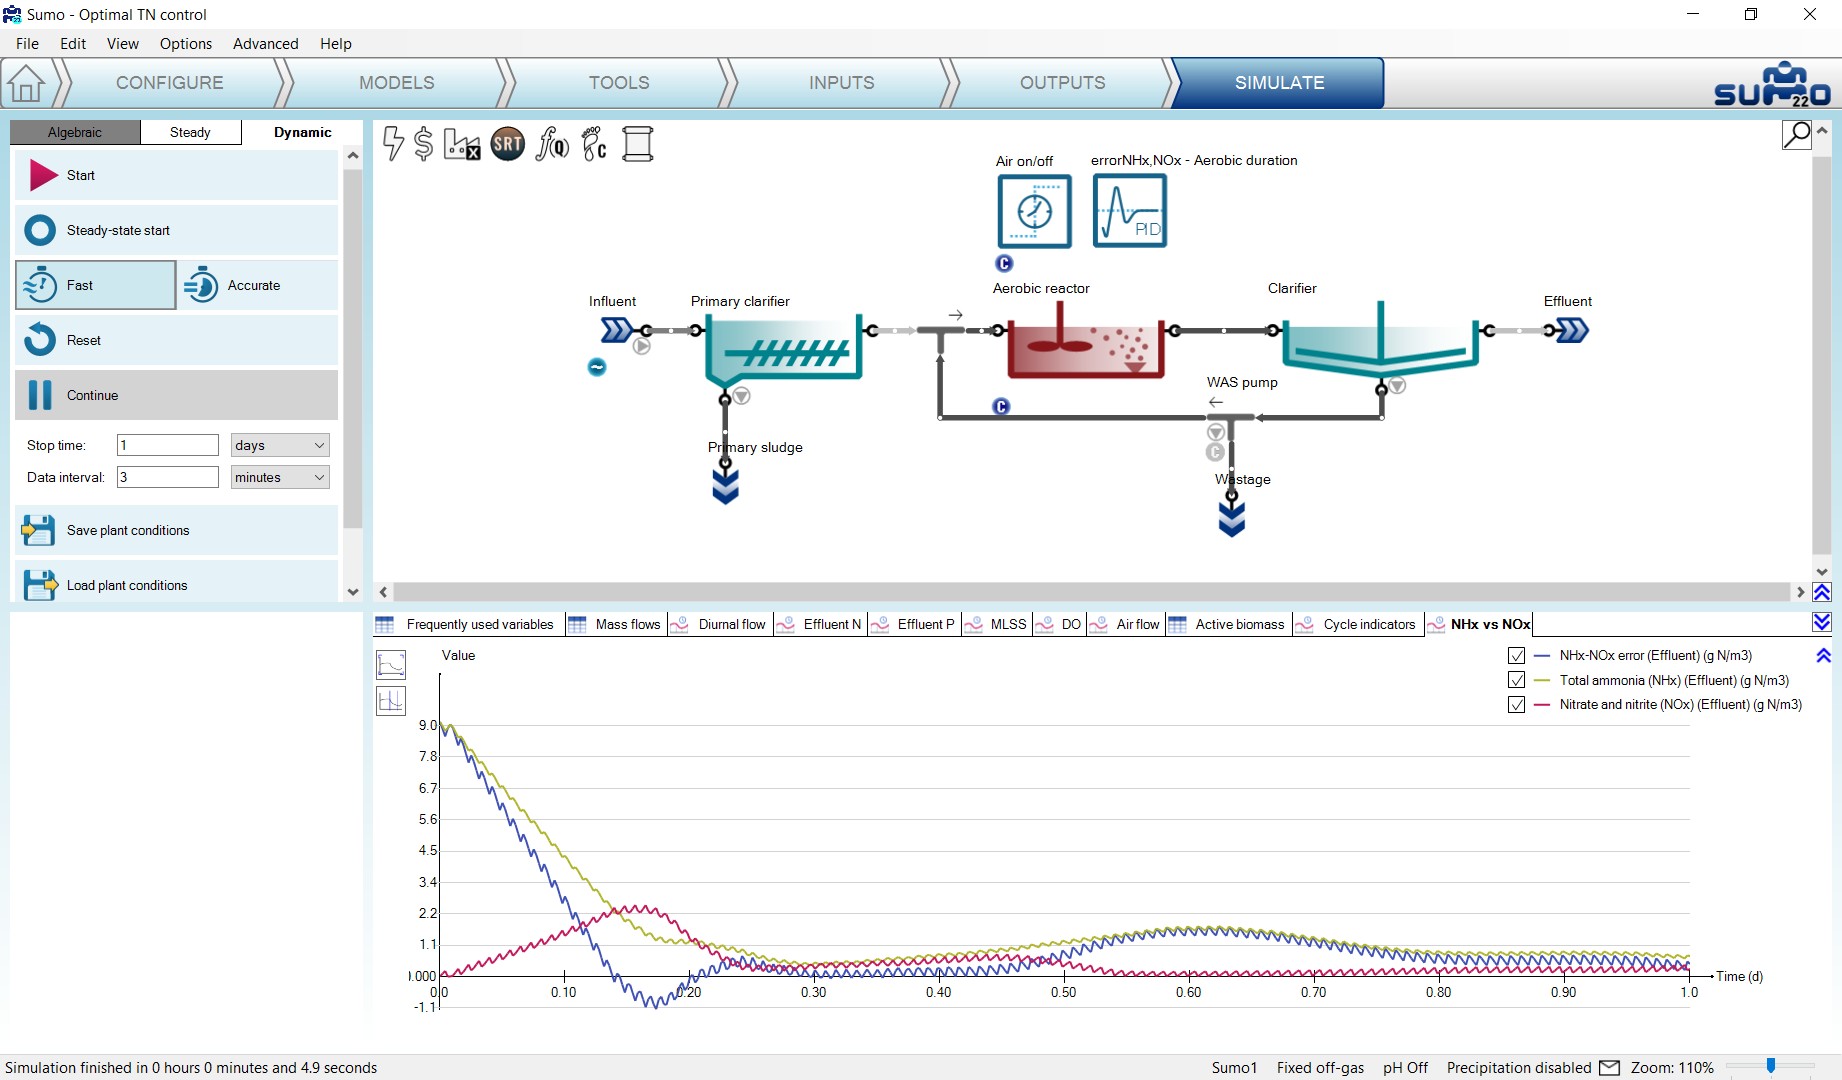
This example demonstrates the application of the cascade controller strategy to aerate a reactor according to a setpoint of the sum of effluent ammonia and nitrate concentrations, by using a combination of a PID and a time based on/off controller (Figure 8.6.4).
¶ Lab tests
¶ P uptake-release test
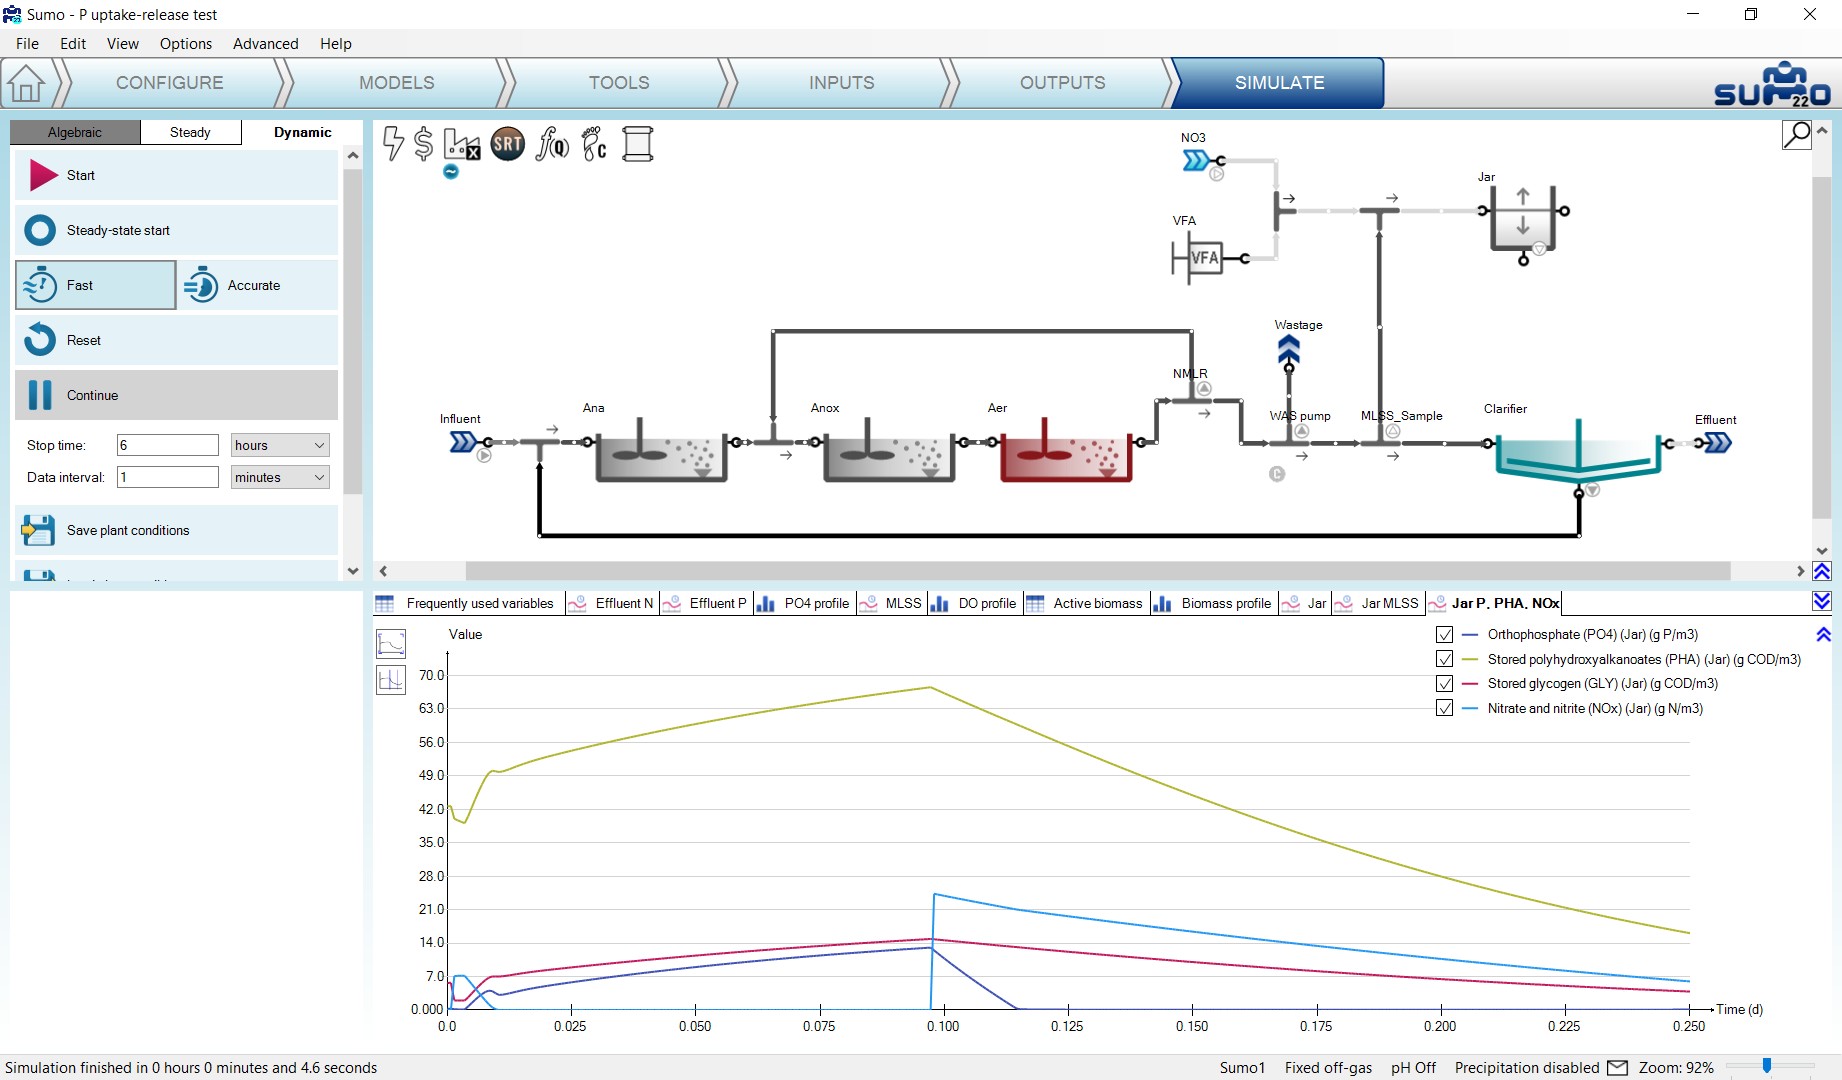
This example demonstrates the possibility of simulating a P uptake-release jar test using a sample taken from a plant configuration (Figure 8.7.1).
¶ Precipitation
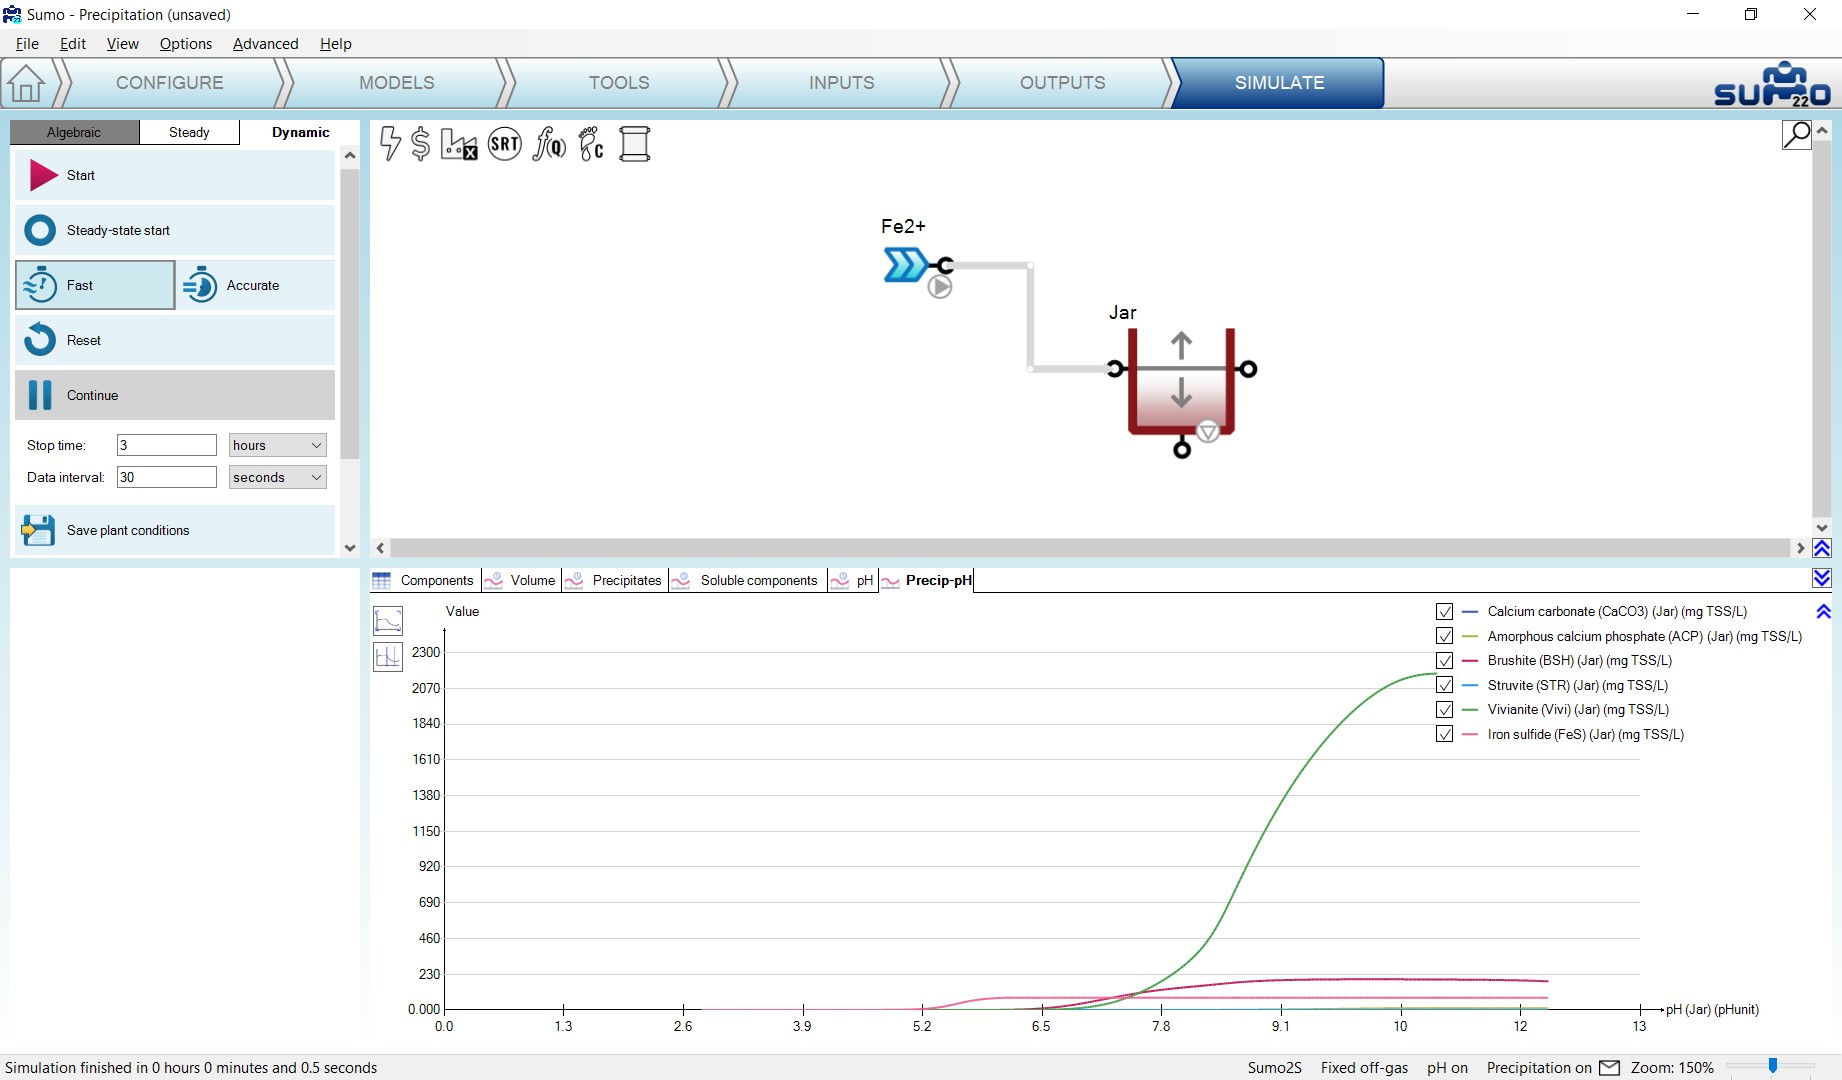
This example demonstrates how the precipitate concentration depends on pH, using the Sumo2S model and an XY diagram, added from the Outputs tab by dropping pH on the X axis and choosing the available precipitates (Calcium carbonate as CaCO3, Amorphous calcium phosphate as ACP, Struvite as STR, Vivianite as Vivi and Iron sulfide as FeS) in the tank for the Y axis (Figure 8.7.2).
¶ Respirometer
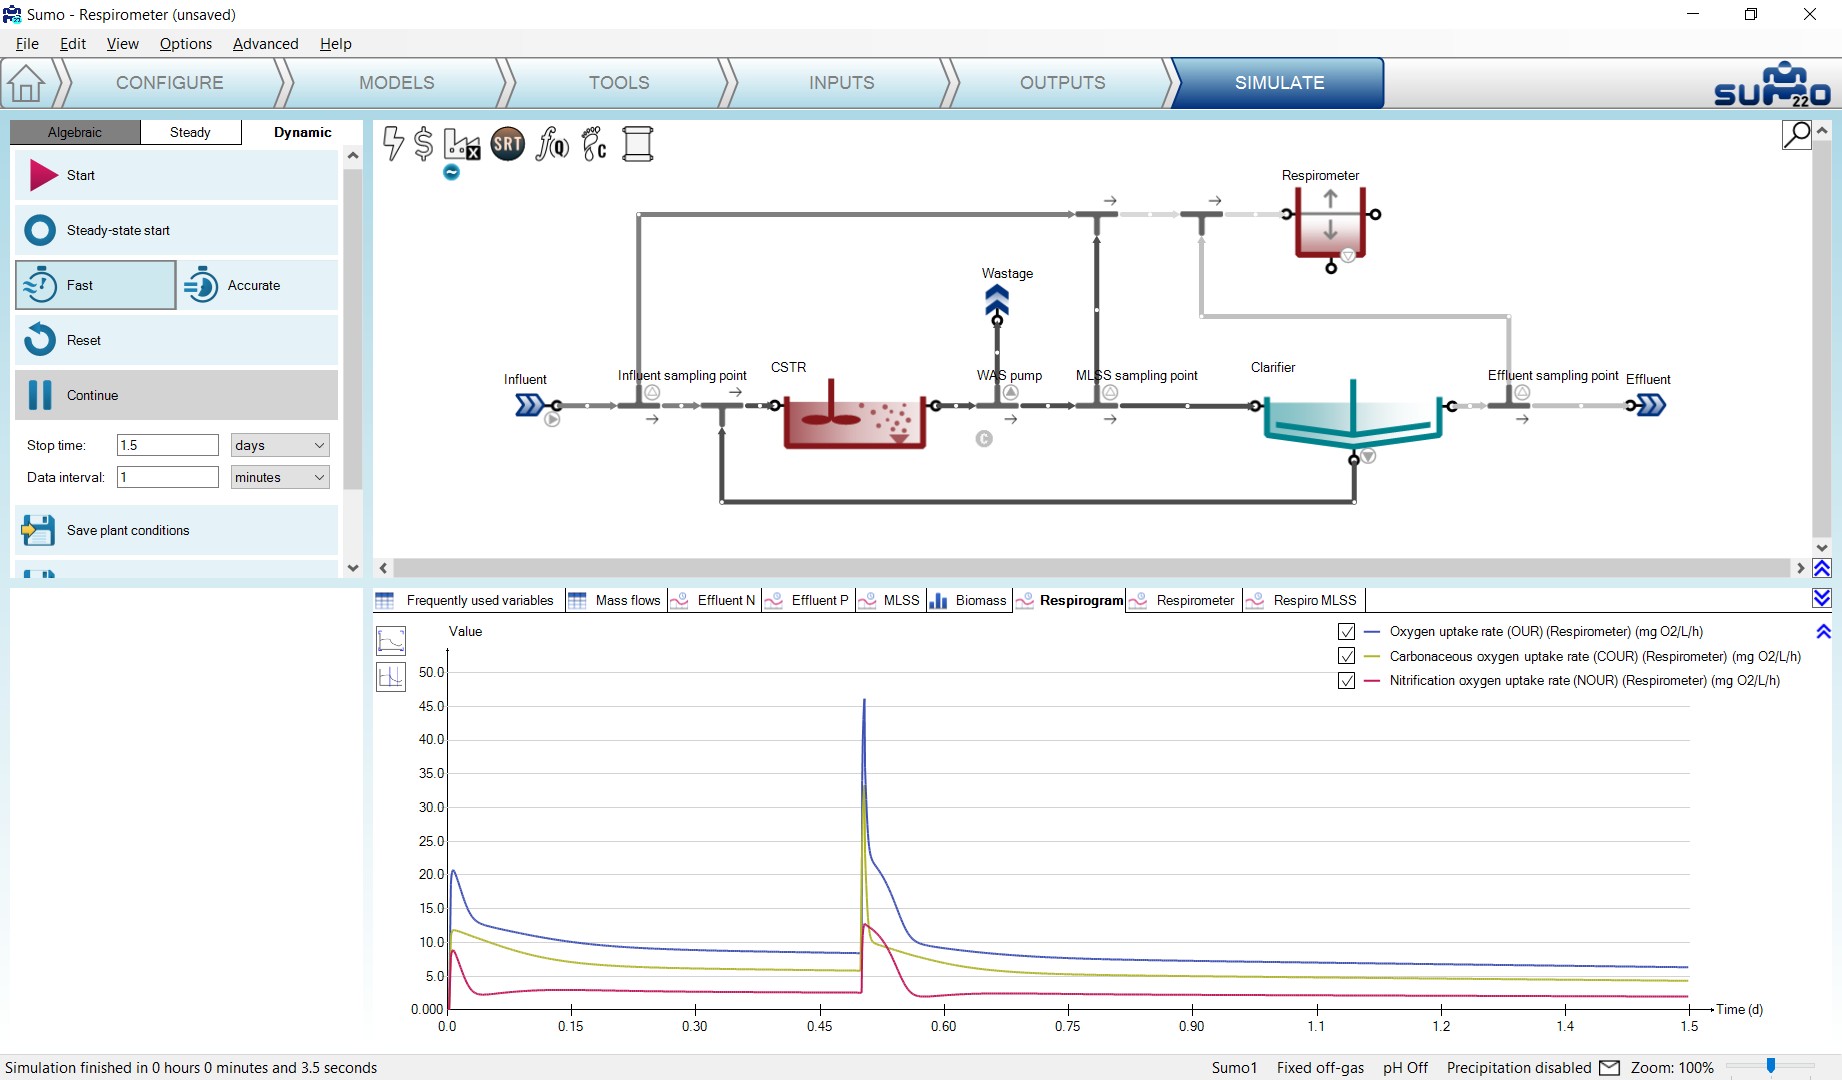
This example demonstrates the possibility of simulating a respirometer (Figure 8.7.3).
¶ Titration of ammonia solution
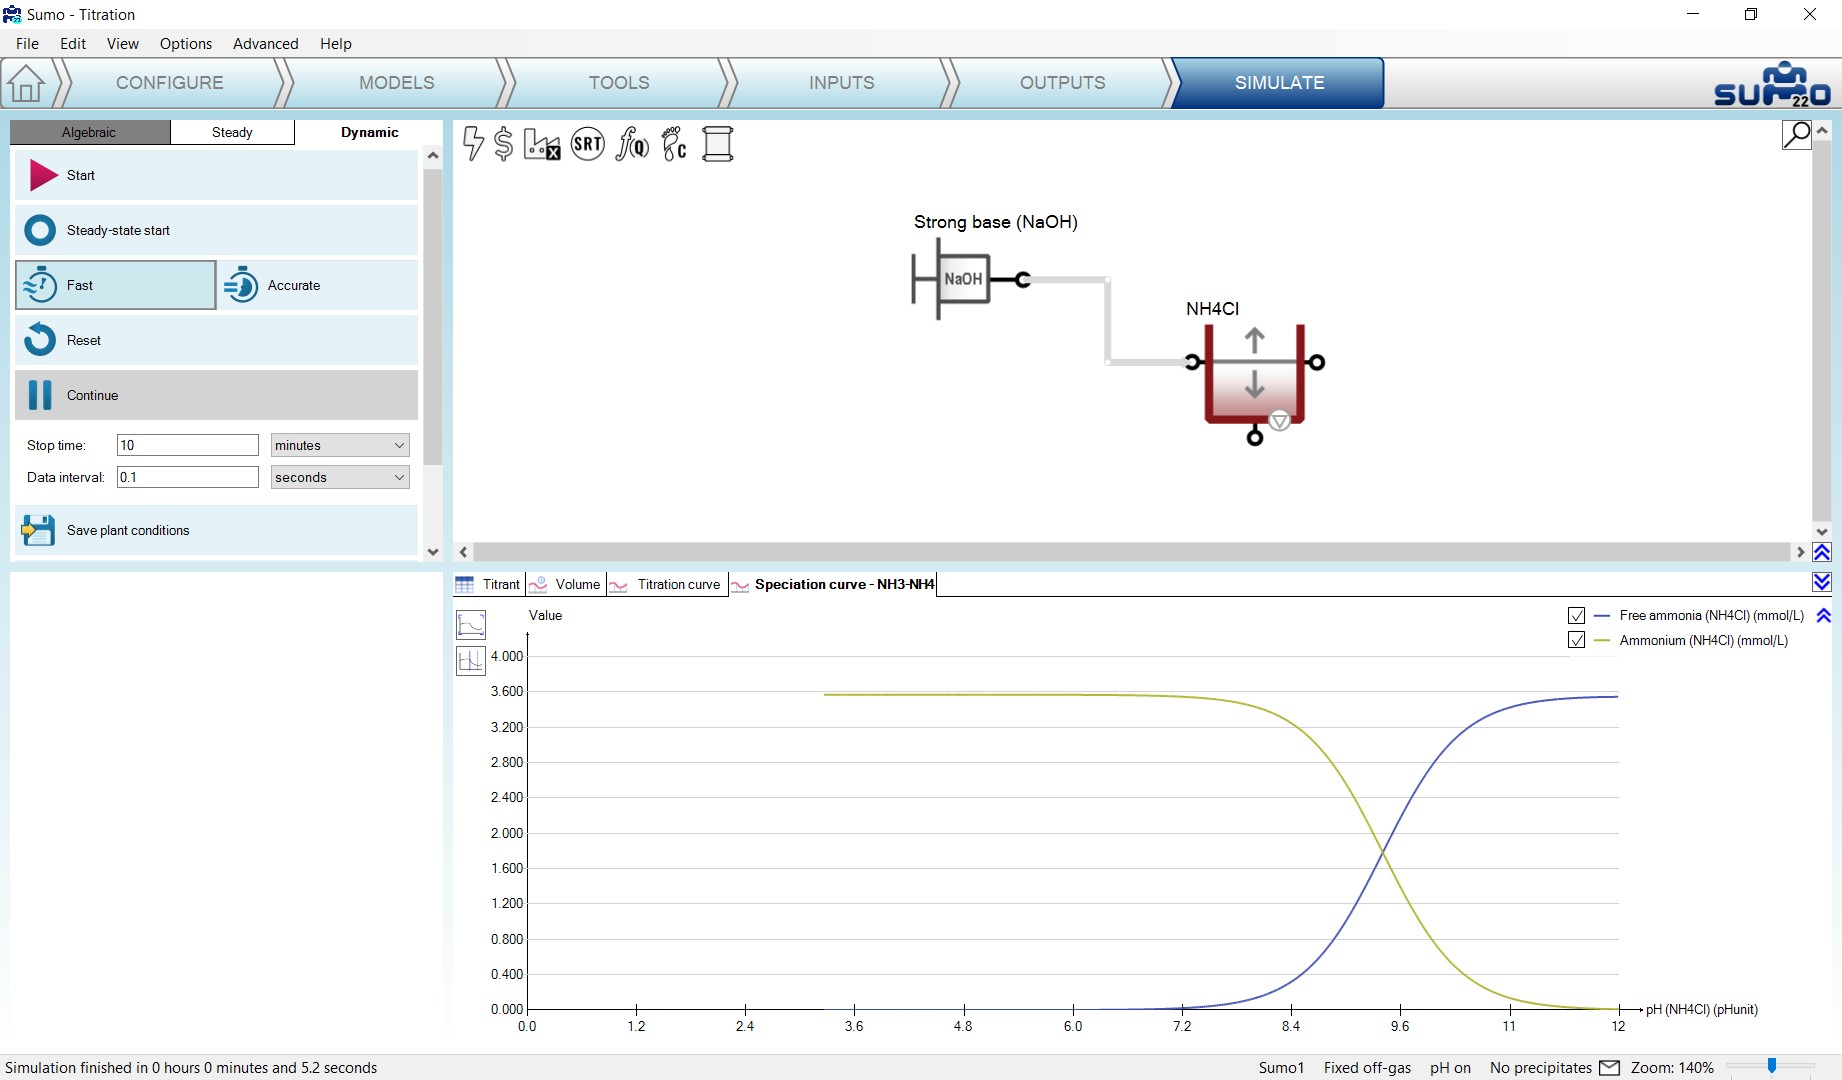
This example demonstrates the ammonium/ammonia relationship depending on pH, using an XY diagram, added from the Outputs tab by dropping pH on the X axis and choosing the NH4+ and NH3 in the tank for the Y axis (Figure 8.7.4).
¶ Digestion and Energy
¶ AB plant
This layout features an adsorption/bio-oxidation process configuration, known for enhanced carbon capture.

¶ AB plant with energy
AB plant with energy calculations turned on.

¶ THP plant
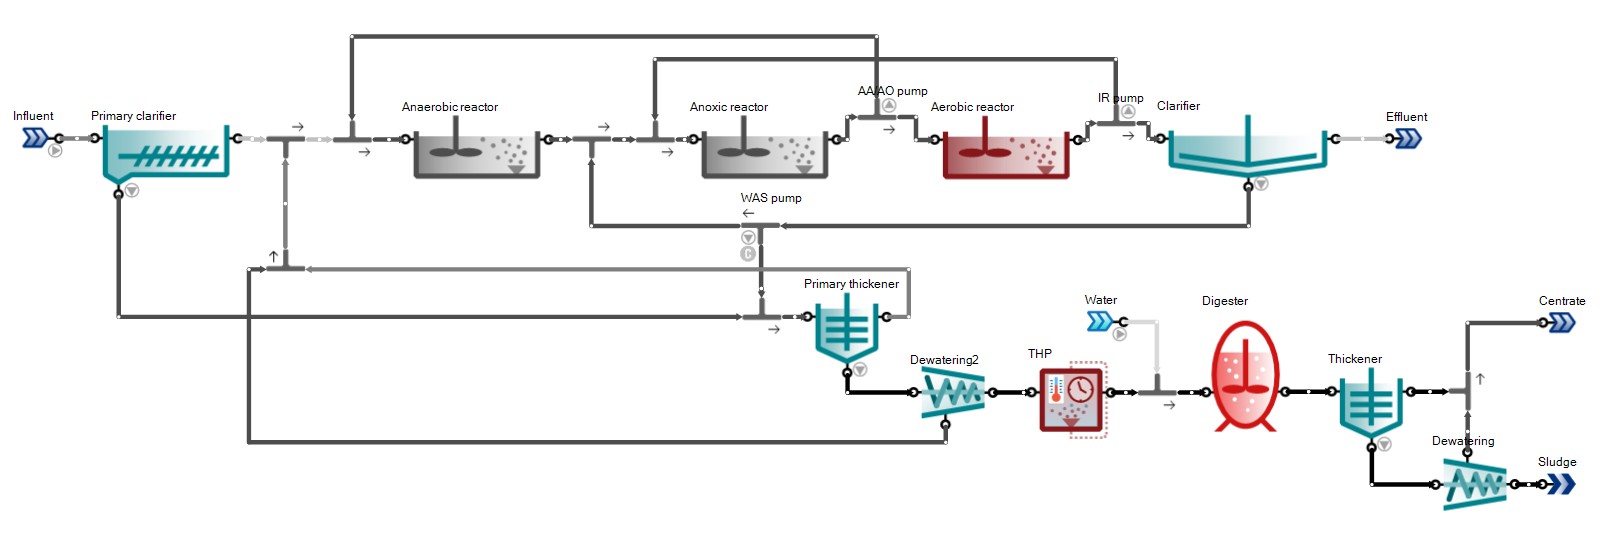
UCT plant with THP sludge pretreatment stage before digestion. Off-gas and pH calculations are turned on.
¶ UASB plant with energy
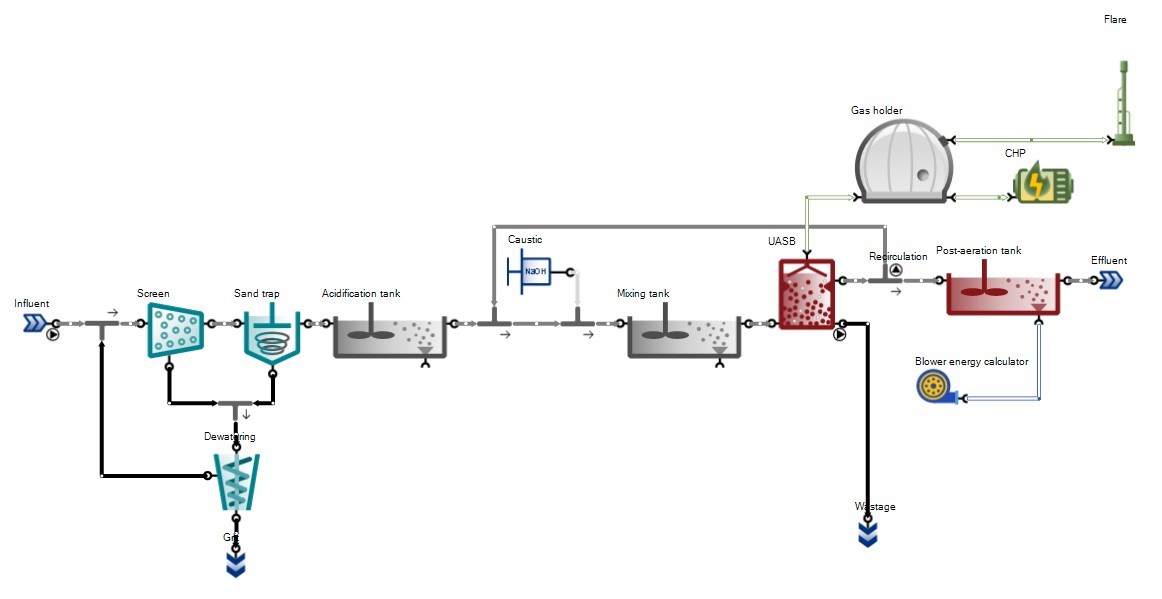
This example layout features a plant with upflow anaerobic sludge blanket reactor with post-aeration and energy calculations turned on.
¶ Miscellaneous
¶ HPO configuration
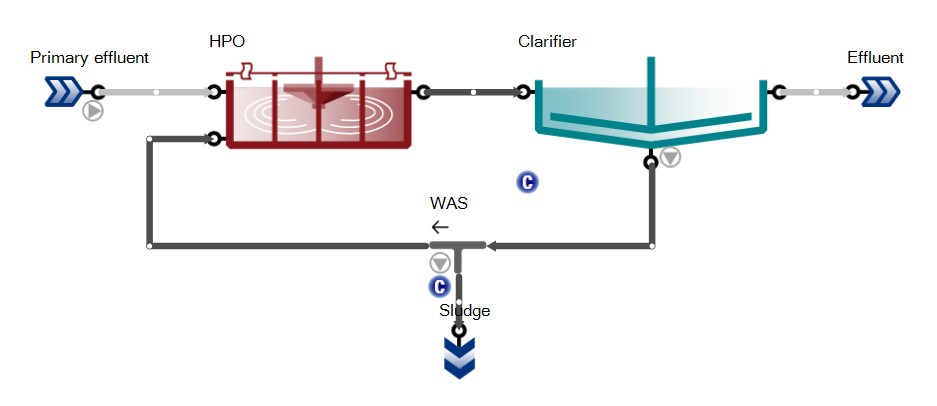
This plant demonstrates the application of high purity oxygen to intensify biological wastewater treatment.
¶ MLE with urban and river catchment extension
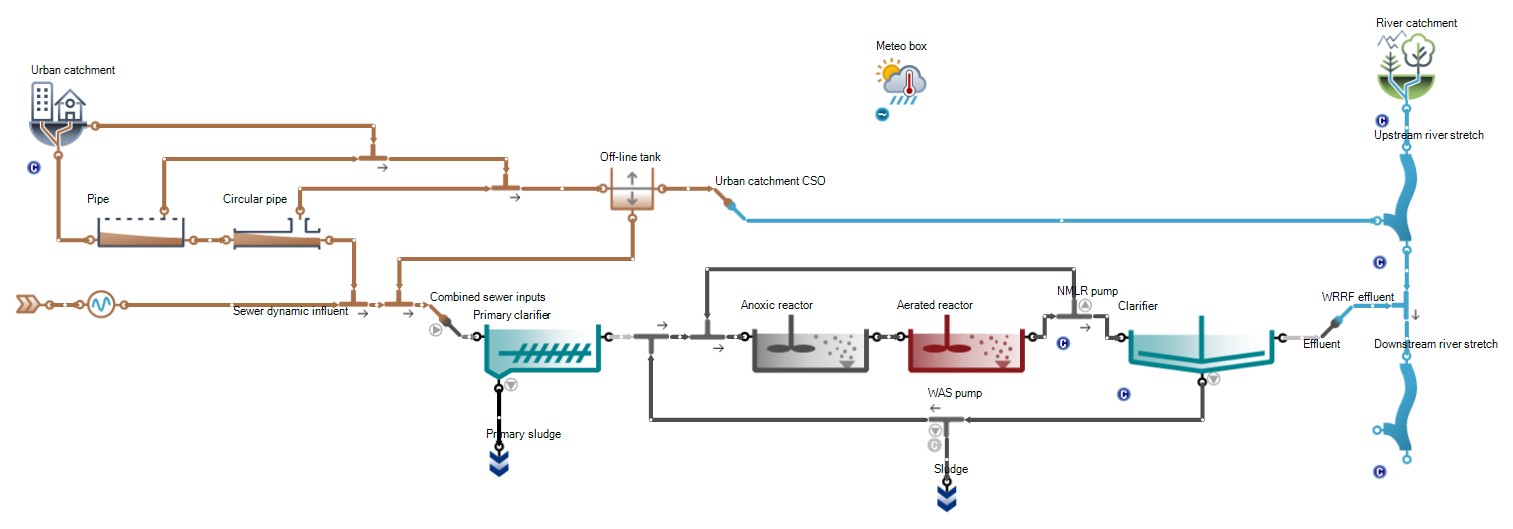
This layout is the extended version of the MLE configuration with an urban catchment and simplified sewer system to generate influent loads and a river catchment with river stretches to model effluent impacts on natural water bodies.
¶ Oxidation ditch
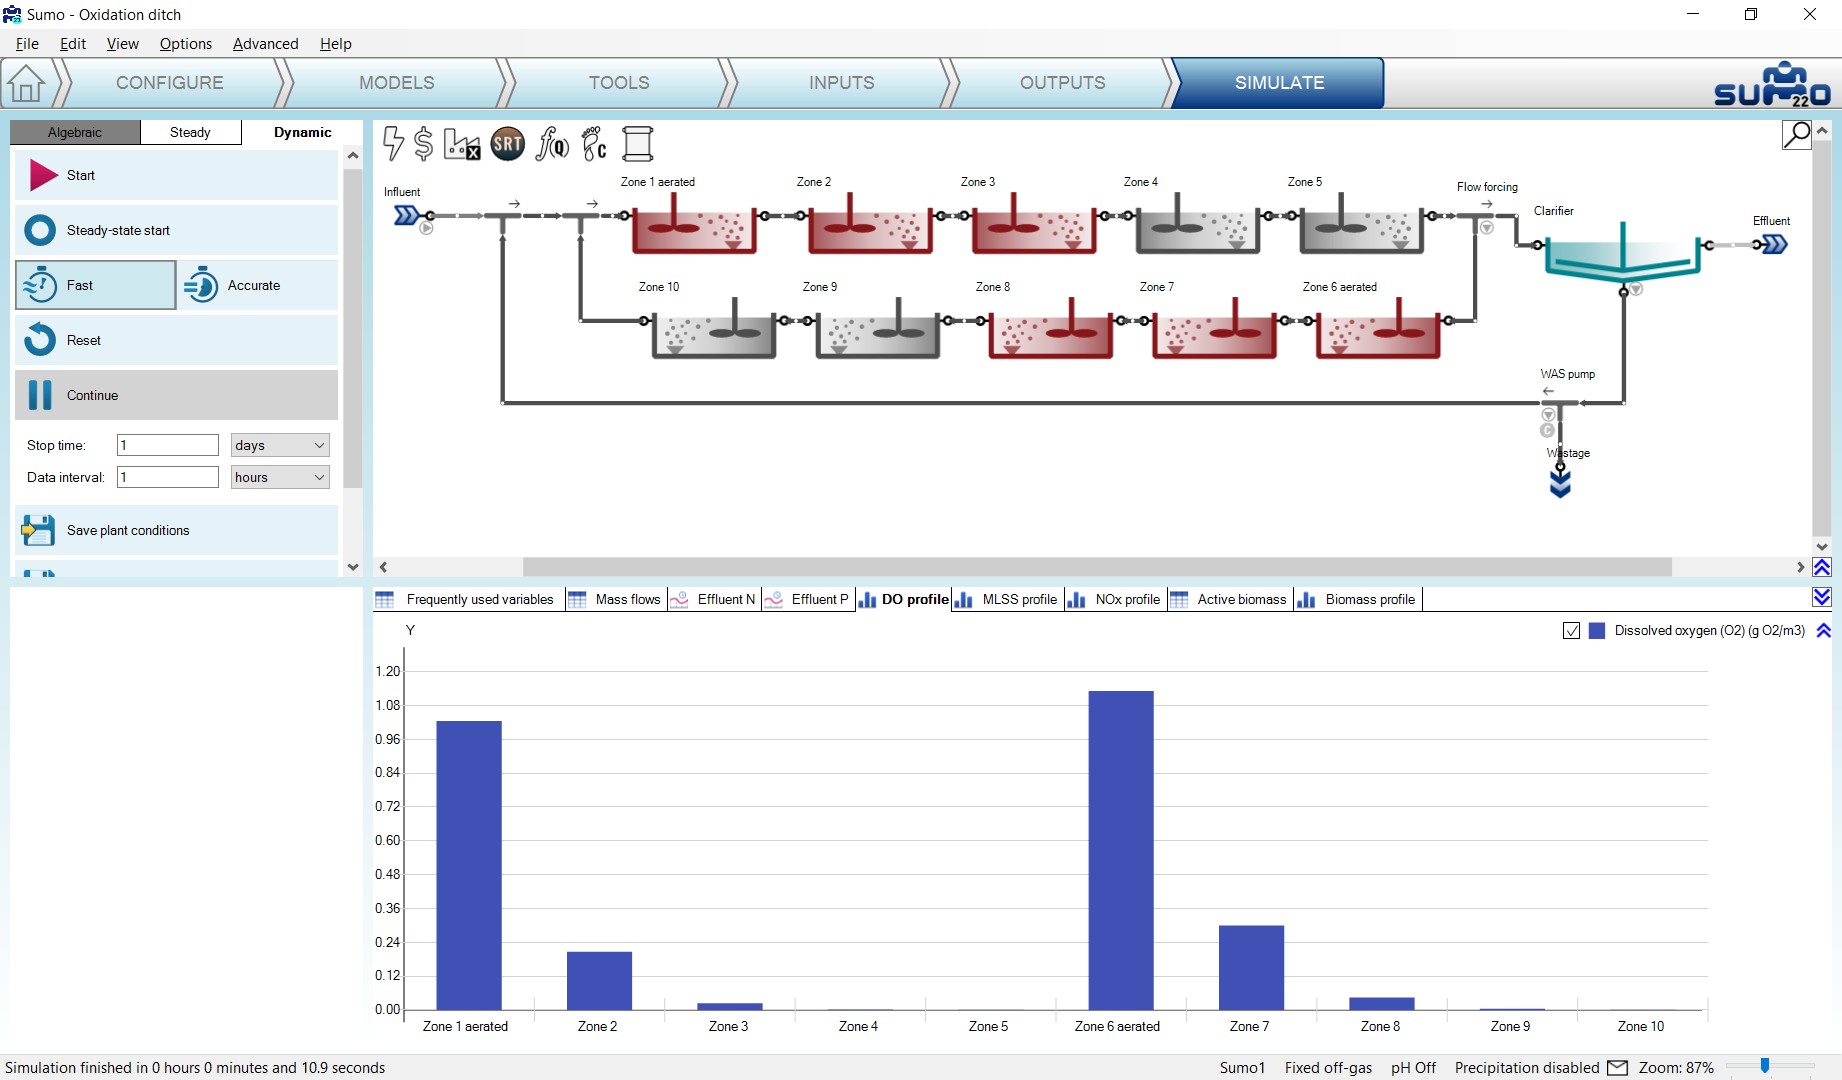
Oxidation ditch example with surface aeration. The ditch is essentially a flow loop and the incoming flow must leave so the outgoing flow must exactly match the influent. The solution to do this in a model is to force the internal flow loop and the rest of the flow overflows to the clarifier. The flow forcing pump does the internal ‘recirculation’ in the oxidation ditch, while the overflow port automatically equals the input flow rate to the ditch.
To calculate the internal flow (which is usually 50-100 times the influent flow) one needs to multiply the forward linear velocity (usually 0.3-0.6 m/s or 1-2 ft/s) in the ditch with the cross sectional area, which will give a m3/d or MGD flow value. This is the value that should be set in the pump.

The Oxidation ditch can be considered ideally mixed as a CSTR for all variables except DO. See the DO profile of the Oxidation ditch on Figure 8.9.4.
¶ Advanced
¶ Autotuning controller
This example demonstrates how to set up an optimization for tuning the proportional, integral and dervitaive gains in order to get the closest match to a target effluent ammonia time series target.
¶ EBPR design
This example demonstrates optimizing anaerobic reactor volume and SRT to meet target MLSS and effluent OP requirements.

¶ Energy and effluent improvement
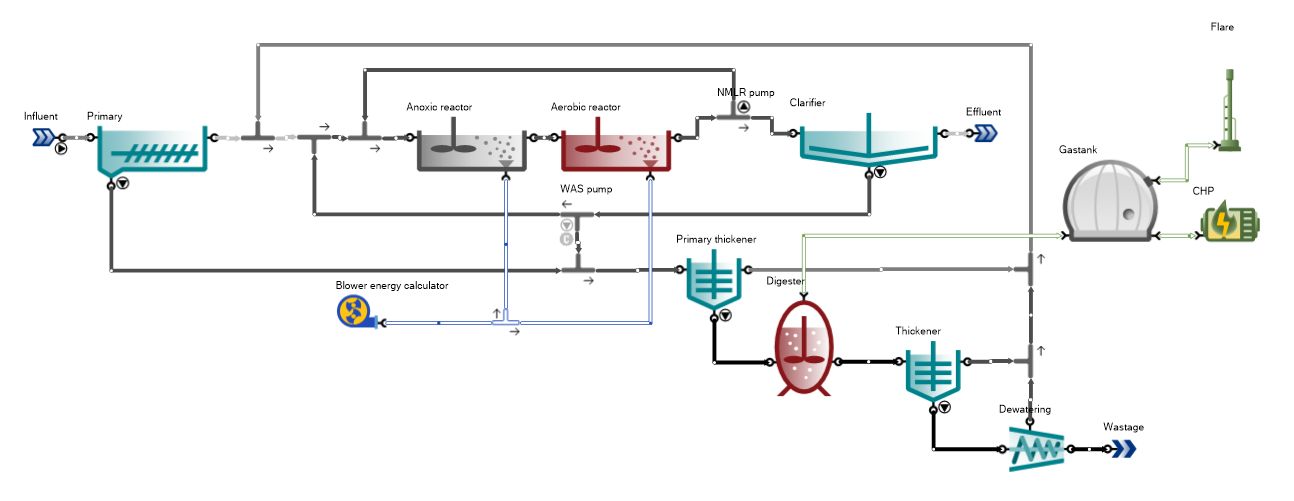
This example demonstrates optimizing operational parameters to meet target effluent ammonia and NOx requirements while keeping energy self-sufficiency at the achievable maximum.
¶ Minimize aeration energy demand
This example demonstrates keeping a target effluent ammonia level with minimum aeration energy demand in a step-feed activated sludge system designed for BOD and ammonia removal.
