¶ Controllers
¶ Introduction to controllers
Controllers are used to set operational parameters based on measured values during the operation of the plant. In Sumo, the controlled values are calculated variables from the simulation. The on-off controller has no controlled variable. The manipulated parameters are input values for the controlled process unit. For example, this way the reactor MLSS can be automatically controlled by manipulating the wastage sludge flow. Another example is setting the air flow into the aerated reactor to maintain a certain dissolved oxygen level.
There are 6 different type of controllers implemented in Sumo, which can be accessed from the Tools tab (Figure 4.1.1):
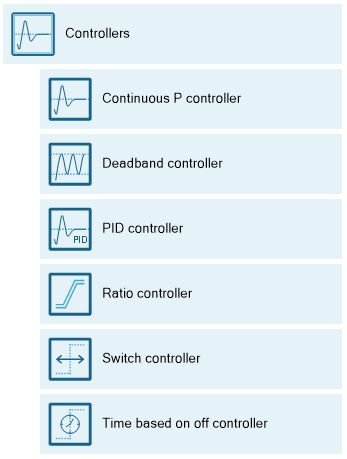
Clicking the Controllers button on the Tools tab will open this dropdown list of controllers, where you can pick the desired one and configure the control variable (CV) and the manipulated variable (MV), which is a parameter in the model; while on the Inputs tab you can fine tune the controller settings. In this chapter, the setup possibilities will be presented for each available controller one by one, based on the example project built in the previous chapter (Using Sumo for simulations).
¶ Parameter handling in SUMO
The Controllers are setting input parameters automatically based on their built in logic. To be able to exploit the flexibility of the controller setup in SUMO the following parameters input hierarchy is important to keep in mind. The parameter gets the value during the simulation:
- Set by controller (any type) when the controller is ON. In this case the parameter value is marked with yellow background at Inputs | Constants. Controller on/off can be handled dynamically.
- If the above is false: The values from dynamic tables or values from scenario input are assigned to the parameter. Note that it is NOT supported to set up scenarios for with dynamic tables.
- If all the above is false: The value from the Inputs | Constants is used.
This logic is valid during the simulation.
+1: Advanced users can set parameter values using SumoCore commands.
¶ Continuous P controller
The Continuous P controller is a model controller that continuously sets (integrates) the input parameter (Manipulated variable) of the desired unit to meet the control variable value setpoint (as opposed to discrete controllers).
Add this controller to the layout from the Tools and configure it as follows. First drag and drop the manipulated process unit (Reactor 2) to the left side of the equation in the bottom right screen panel and the controlled unit (Effluent) to the right side of the equation. On the bottom left screen panel, you can now select the control variable and the manipulated variable in the respective units. In this example, we will manipulate the requested DO setpoint to maintain the desired ammonium concentration in the effluent. Rename the unit (using F2 or right click) to “Ammonia control” (Figure 4.2.1). You can reposition the controller icon on the drawing board by switching to the Configure tab and dragging the process unit to the desired place.
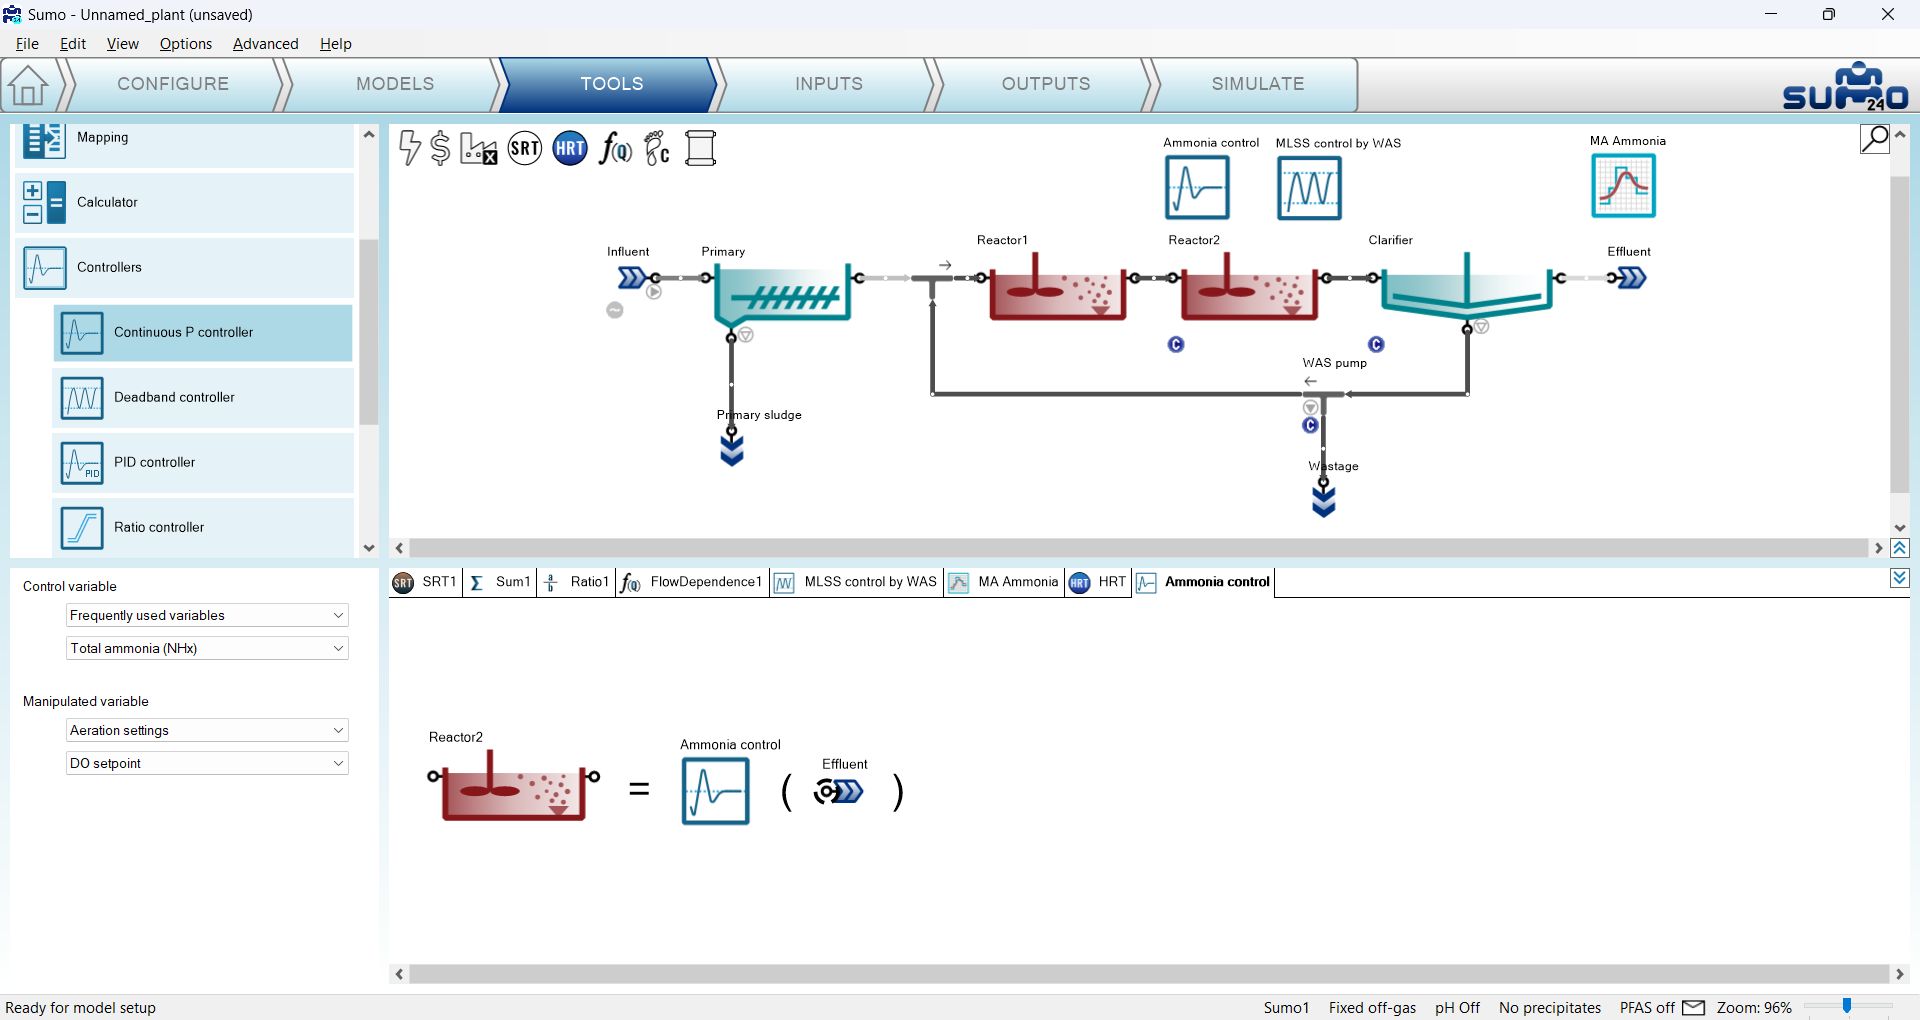
Proceed to the Inputs tab and select the newly added controller. Once the project compiled, in the Controller parameters table, enter the following settings:
- Controlled variable setpoint to 0.5 g N/m3 (target effluent ammonia concentration);
- the Maximum of the manipulated variable value to 3 g O2/m3;
- the Controller direction to -1, because it is an inverse controller (to decrease the ammonia concentration the DO setpoint has to be increased).
At the Controller initialization table, set the Initial value of manipulated variable to 2 g O2/m3 (Input DO setpoint in Reactor 2). Leave the other parameters default (Figure 4.2.2).

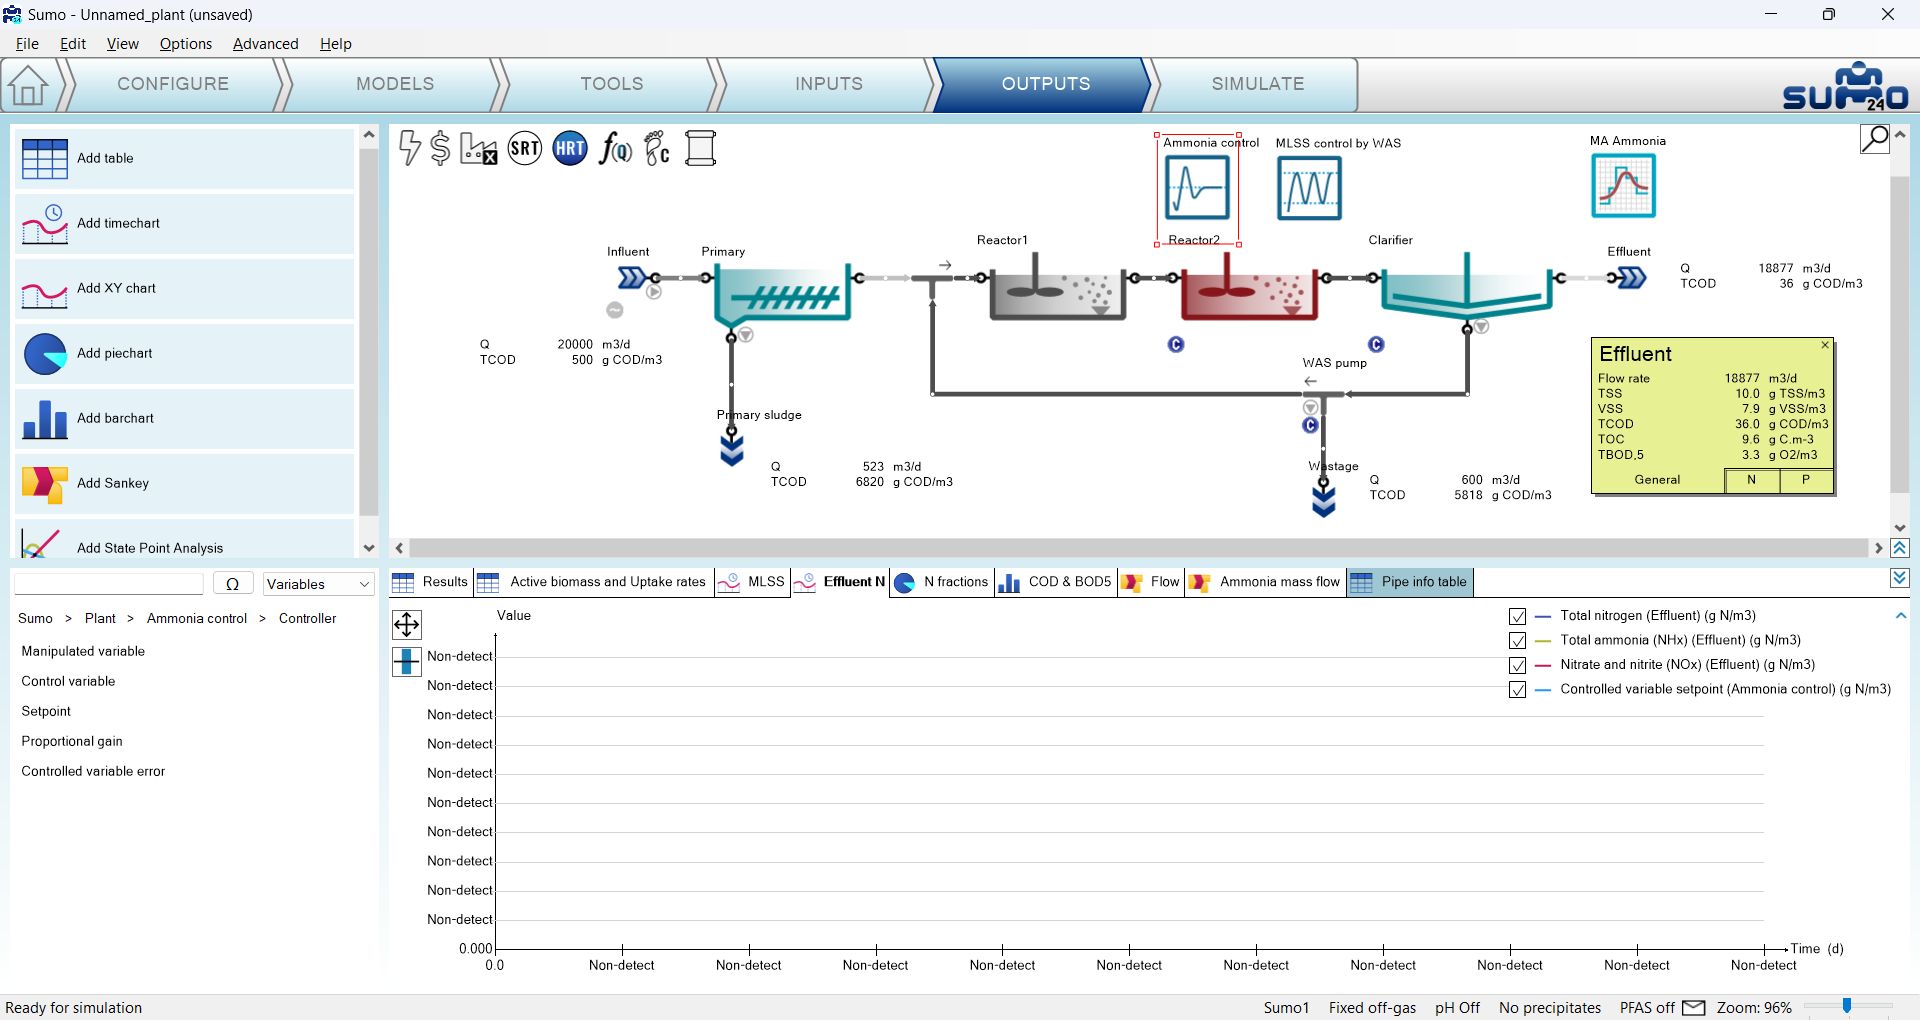
To follow the effect of the controller, you can add the setpoint to the Effluent N timechart on the Outputs tab: select the Ammonia control controller and from the bottom left screen panel, expand the Controller group and add Setpoint to the timechart. (Figure 4.2.3).
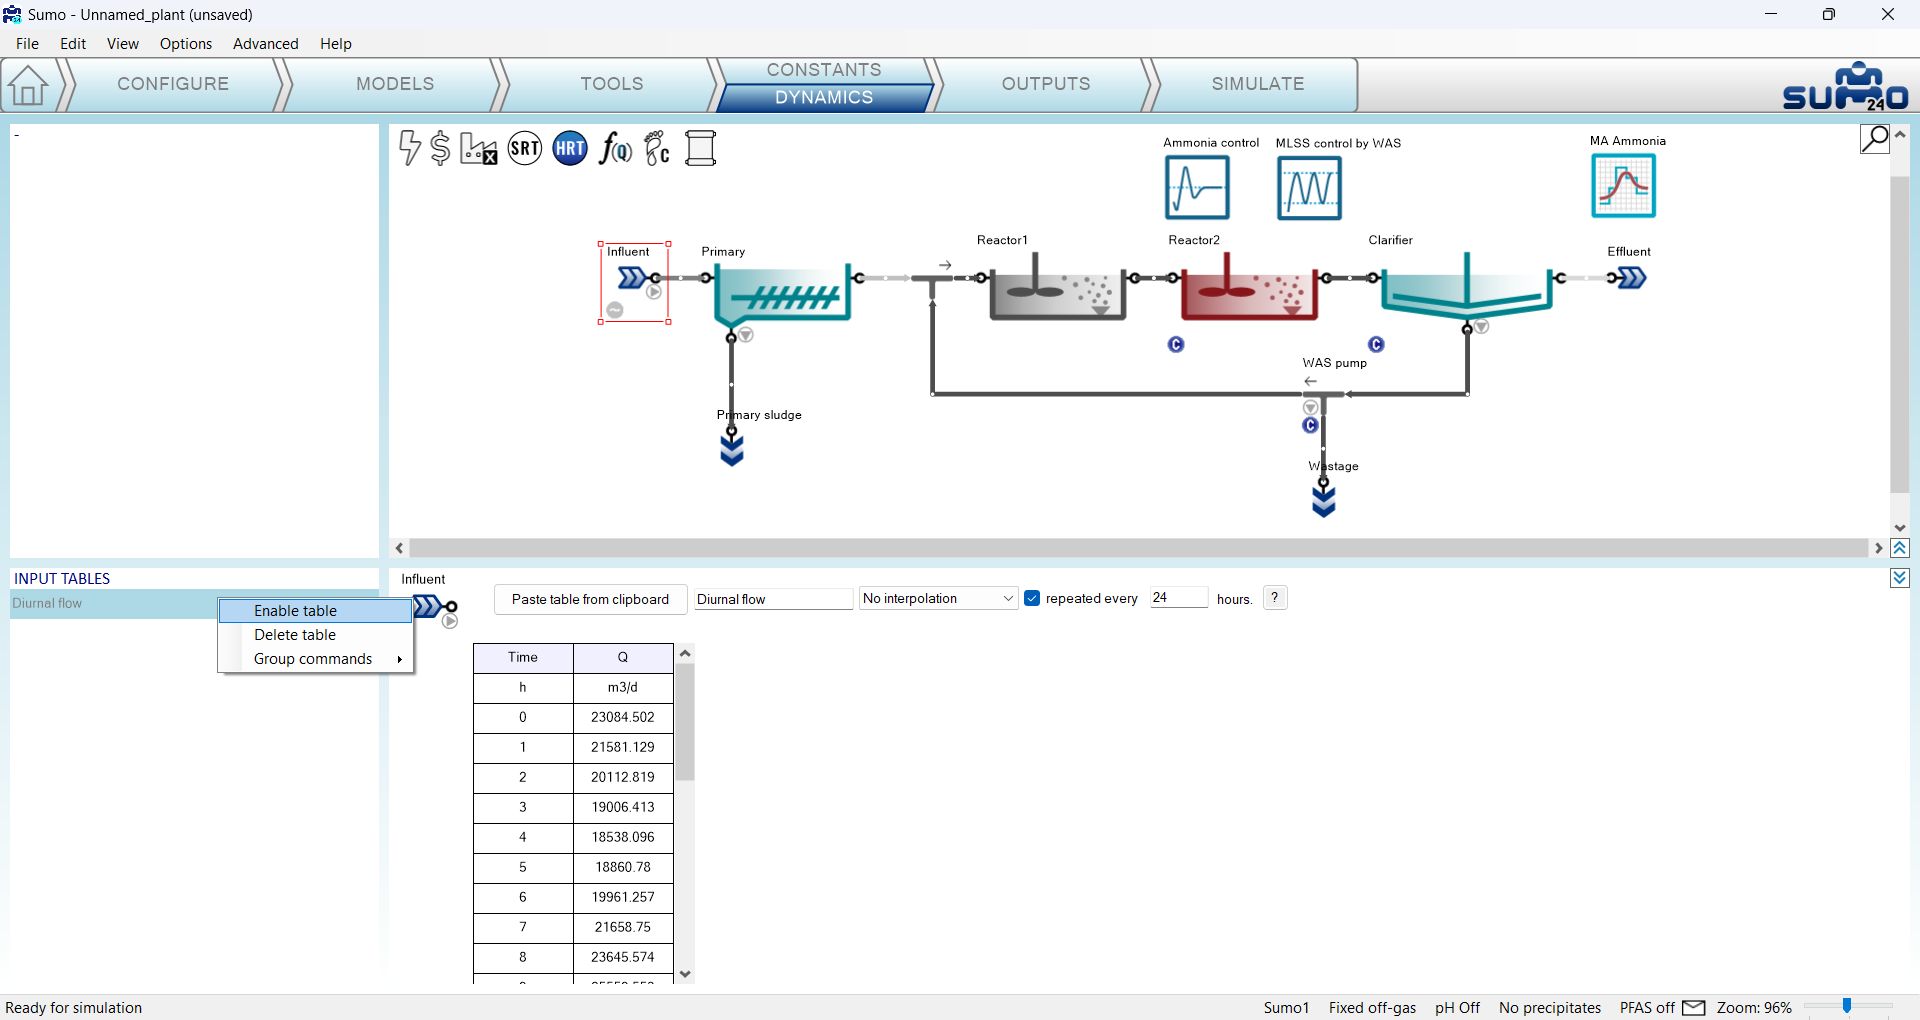
Before starting the simulation, go to the Inputs/Dynamics tab and enable the Diurnal flow dynamic input table of the Influent in order to have changes in the ammonia load (see Figure 4.2.4).
Finally go to the Simulate tab, set the Stop time to 1 day and the Data interval to 1 minute (to see finer details of the operation of the controller) and run the simulation. During the calculation, you can follow the change of the effluent ammonium along with nitrate and nitrite on the previously extended chart (Figure 4.2.5).
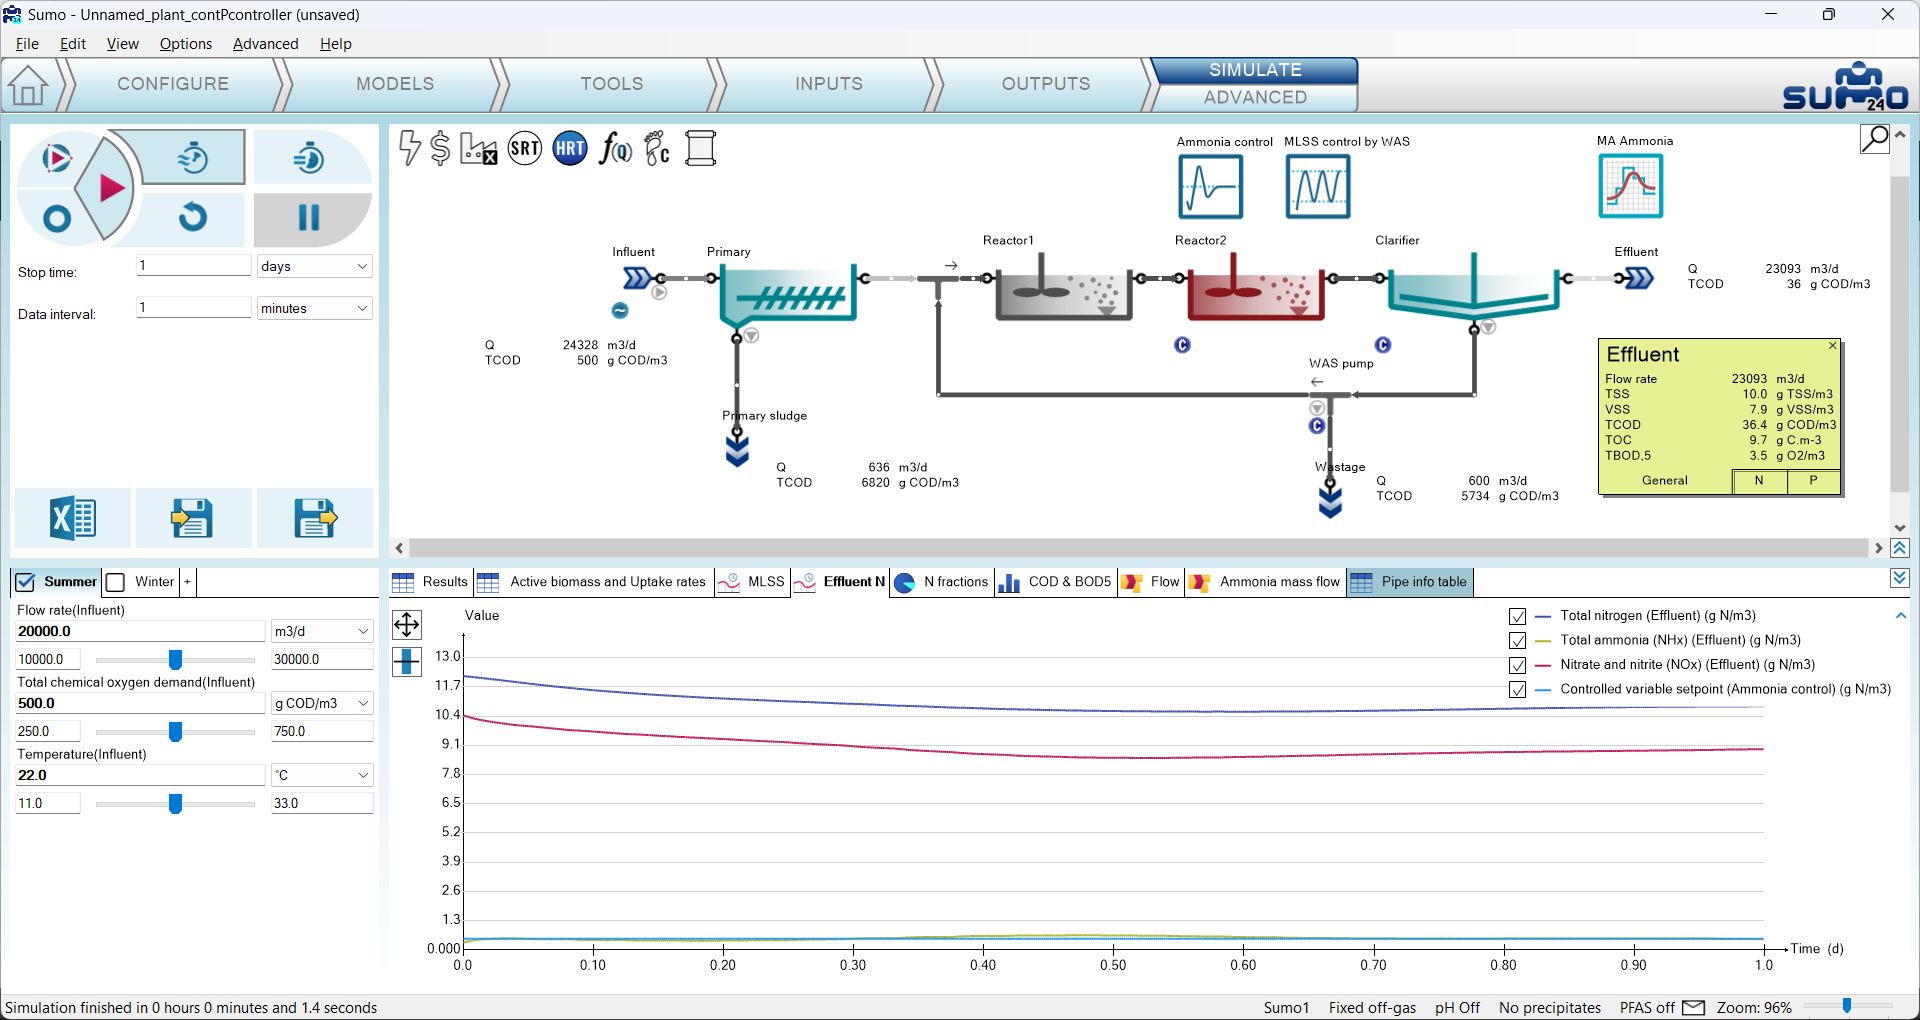
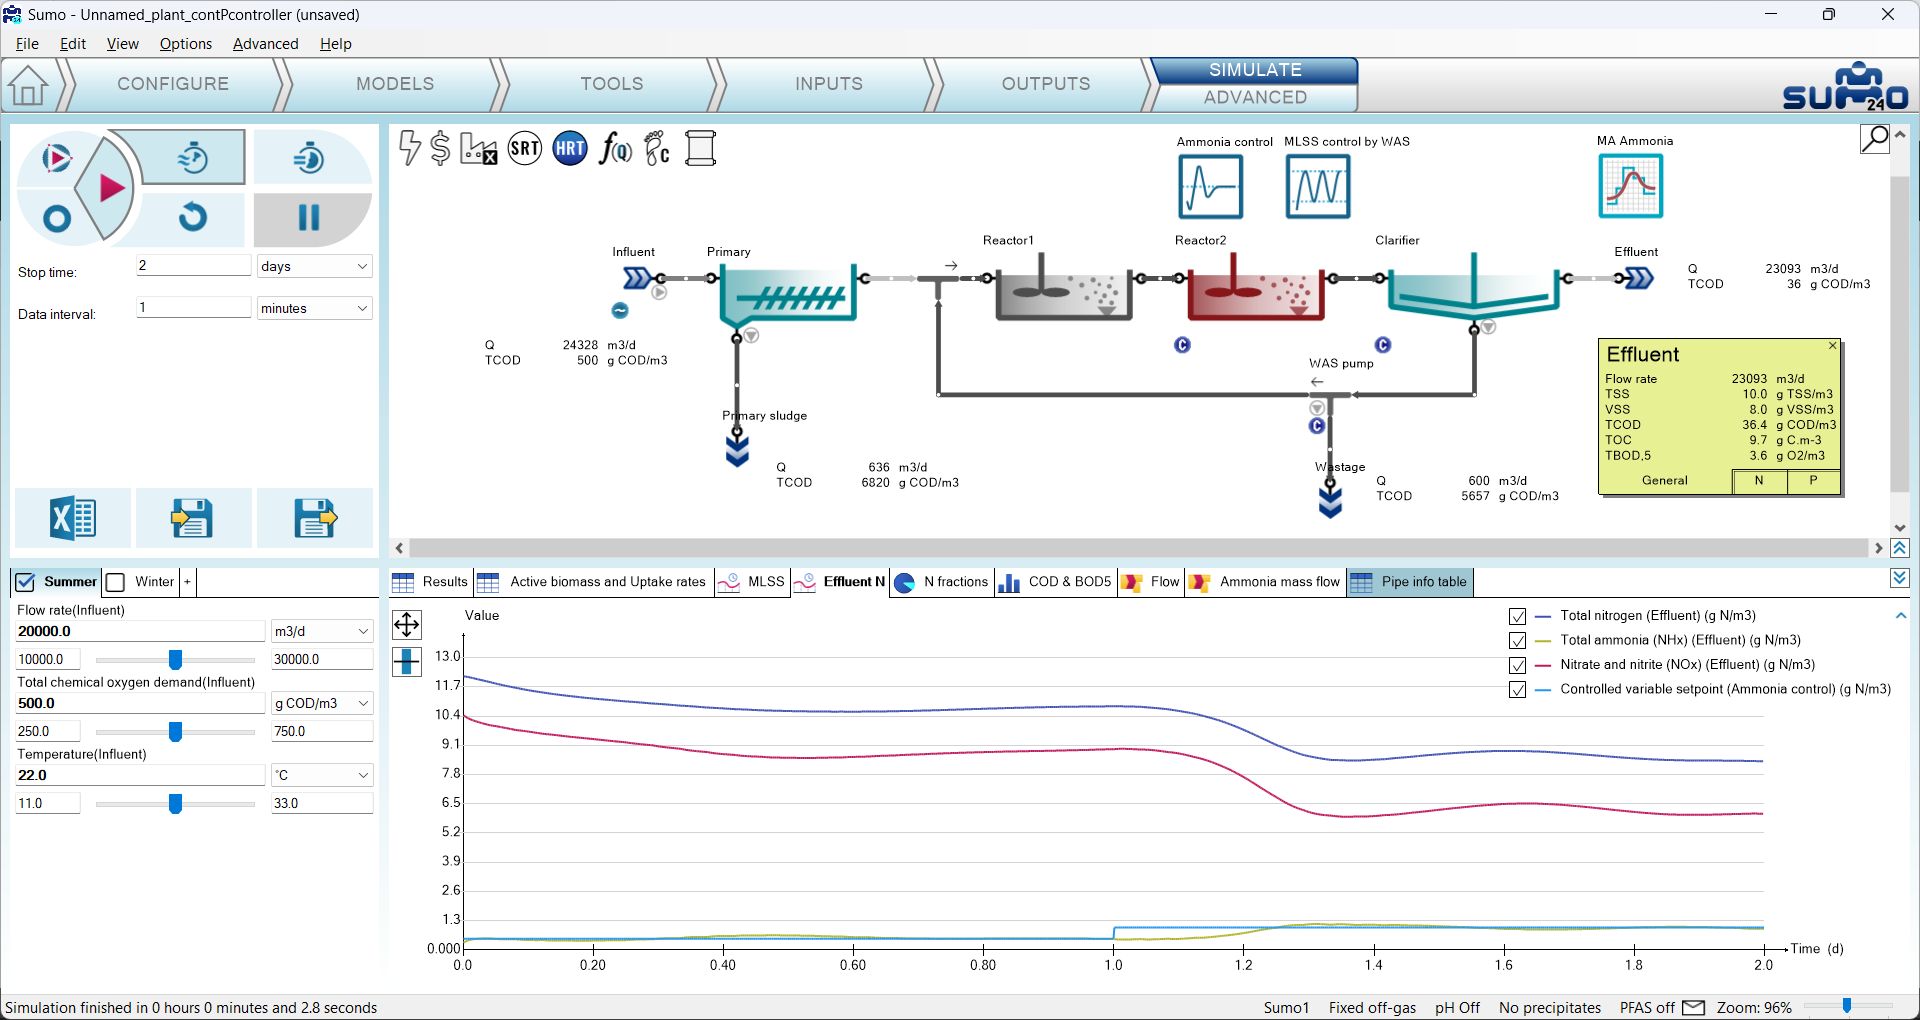
To modify the setpoint of the controller, go to the Inputs tab, select the Ammonia control controller and modify the setpoint to 1.0 g/m3 (effluent ammonia concentration). On the Simulate tab increase the Stop time for 2 days and continue the simulation (Figure 4.2.6).
Note: Keep in mind that the effluent fluctuation is caused by the influent diurnal flow and the MLSS deadband controller, which are independent of the continuous P controller.
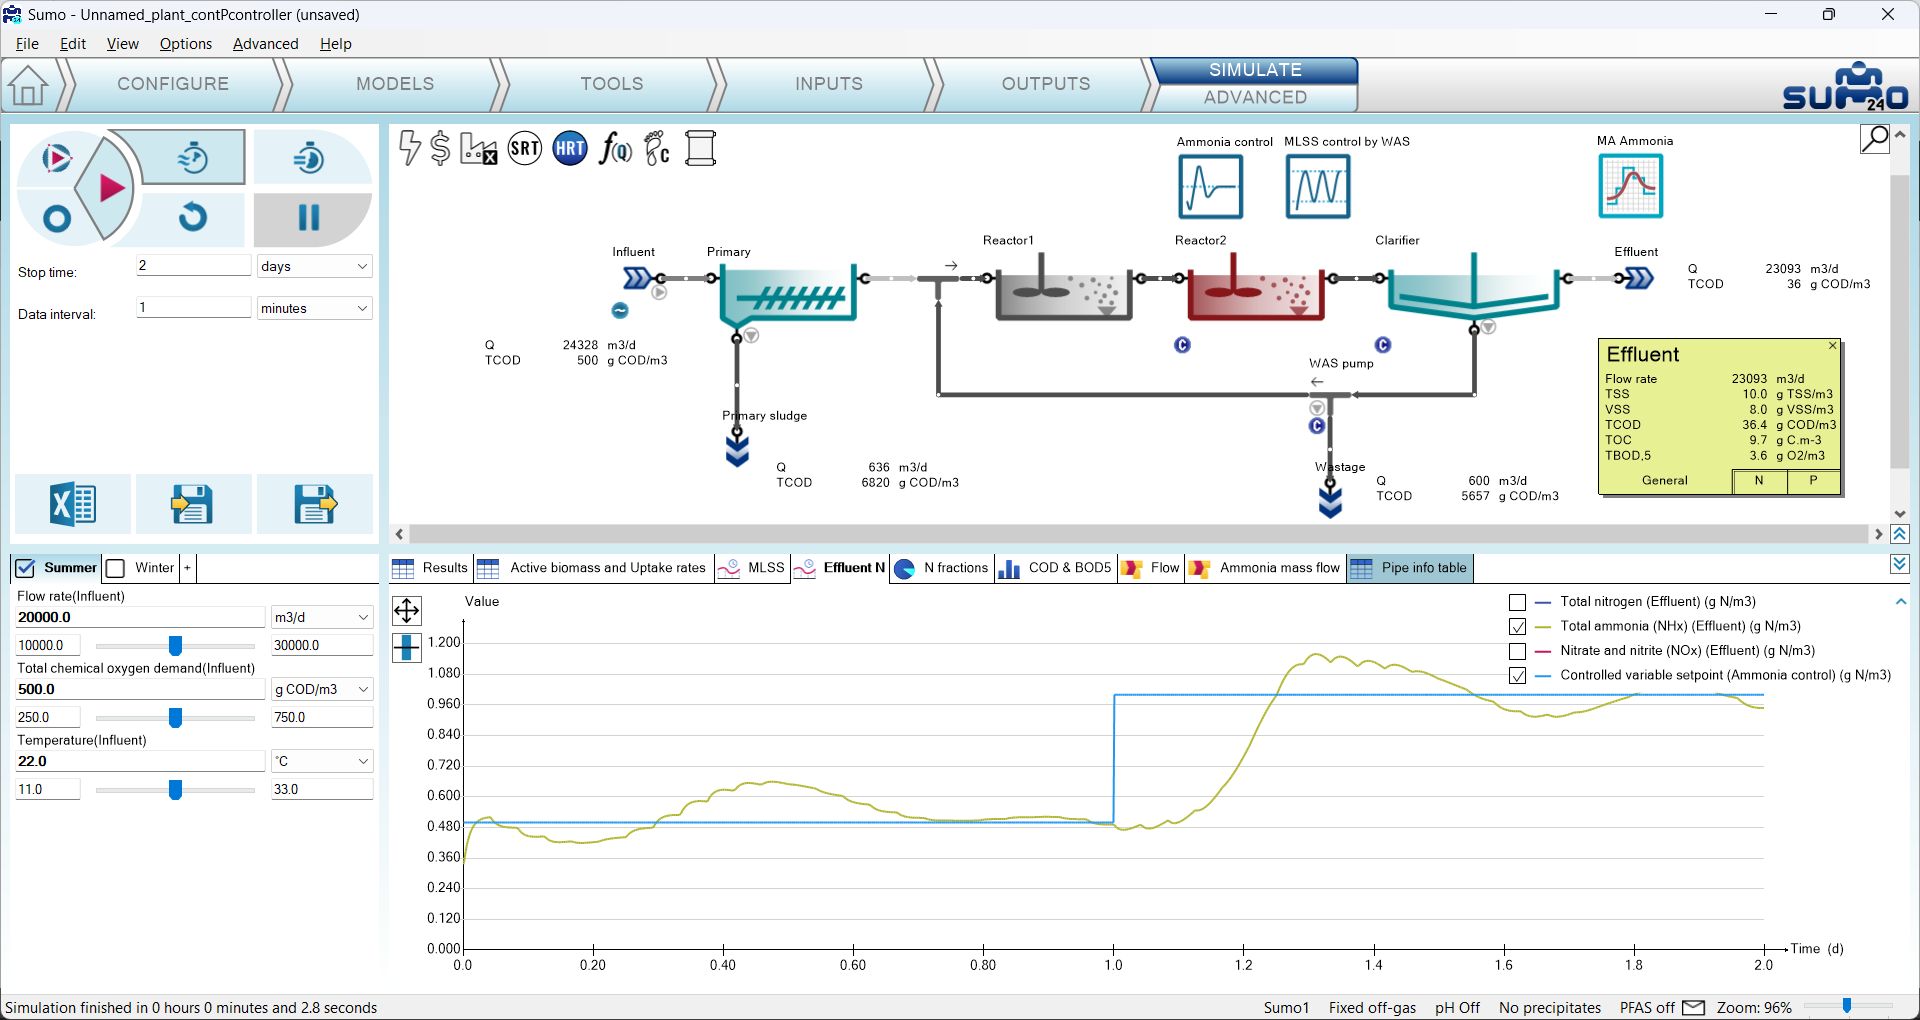
The Total nitrogen and the Nitrate and nitrite (NOx) curves can be unchecked in the graph legend, thus the smooth changes in the effluent caused by the controller DO setpoint modification can be seen in detail. (Figure 4.2.7)
¶ Deadband controller
In an earlier chapter we added a Deadband controller to manage the MLSS in the reactors.
¶ PID controller
The PID controller is using a discrete time step to set the input parameter (manipulated variable) of the desired unit to meet the controlled variable setpoint.
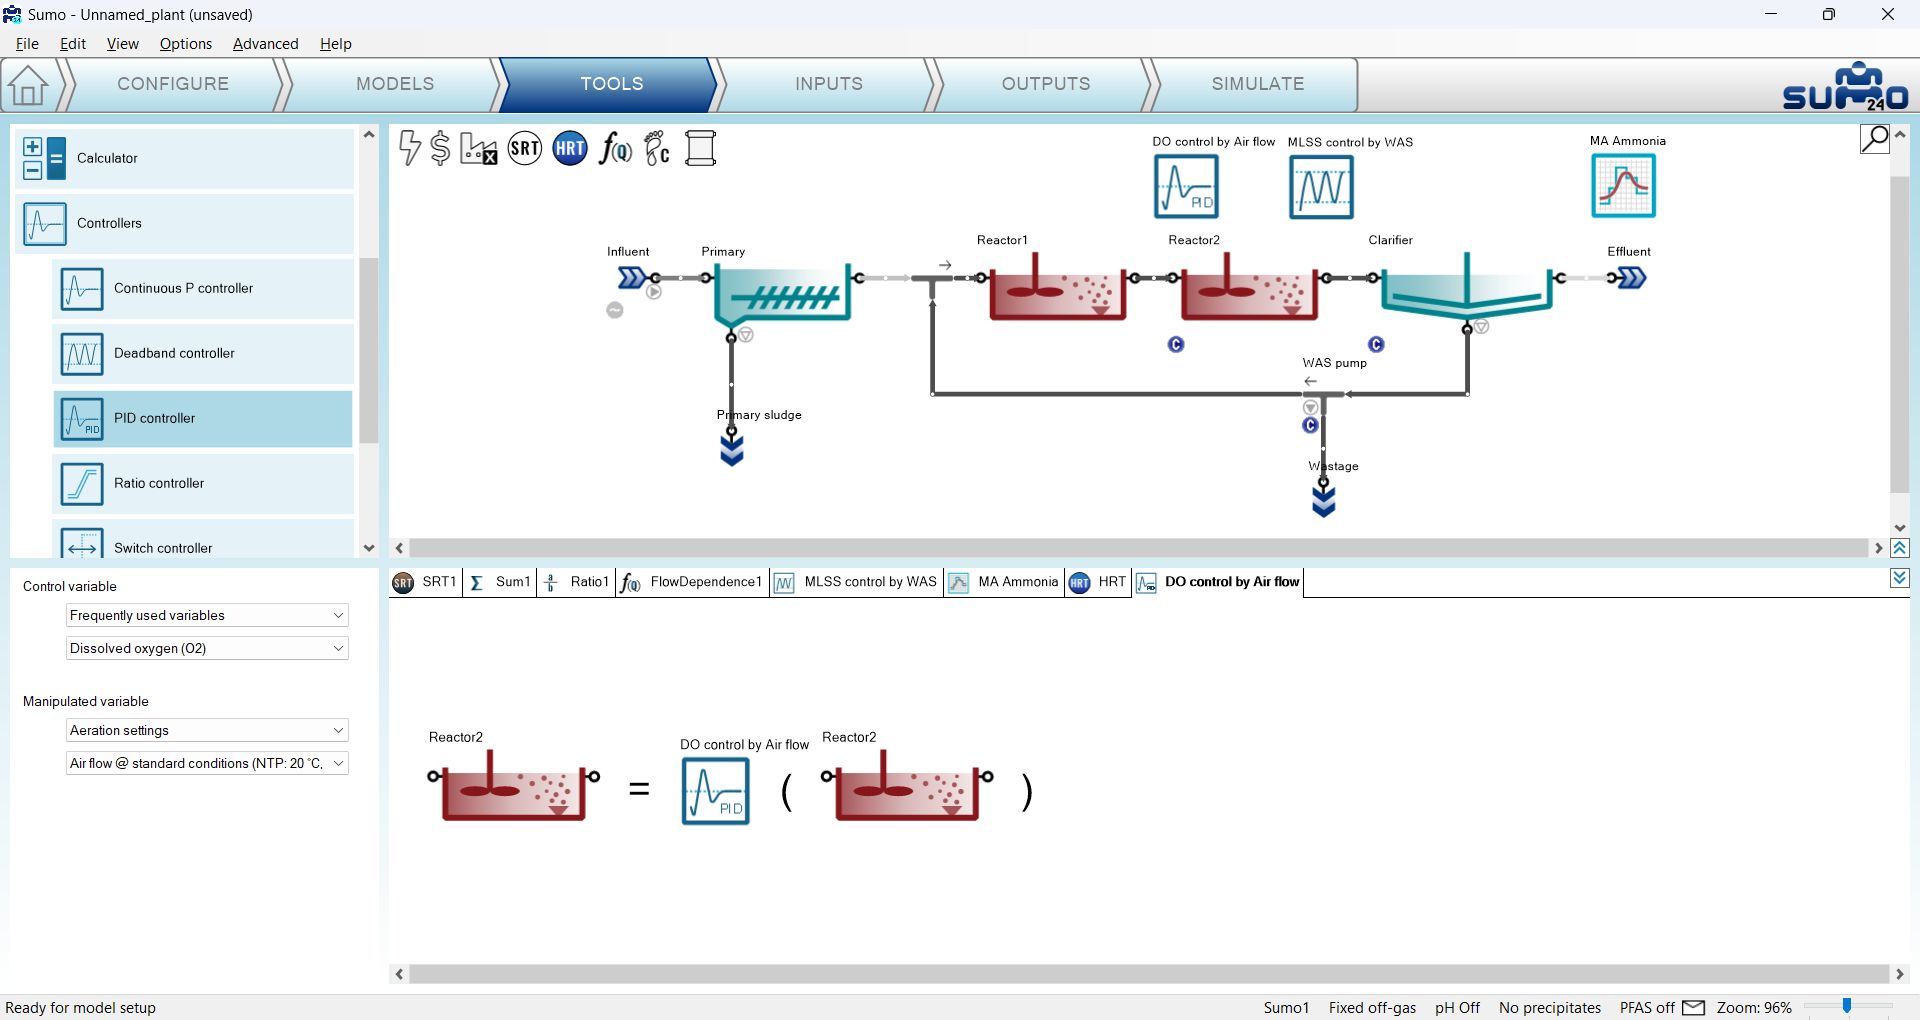
To demonstrate the capabilities of this controller, let us set Reactor 2 of the example project to use the Calculated option for Dissolved oxygen (Configure tab). Then add the controller and configure on the Tools tab as follows. First drag and drop the manipulated unit (Reactor 2) to the left side of the equation in the bottom right screen panel and the control unit (also Reactor 2) to the right side of the equation. In the bottom left screen panel, you can now select the control variable and the manipulated variable of the selected unit. In this example, we are going to manipulate the requested air flow rate to maintain the desired dissolved oxygen concentration. Rename the controller unit (using F2 or right click) to “DO control by Air flow” – this will rename the tab as well (see Figure 4.4.1). You can reposition the controller icon on the drawing board by switching to the Configure tab and dragging the process unit to the desired place.
On the Inputs tab, select the newly added DO control by Air flow controller. Once the project compiled, in the Controller parameters menu set the following:
- the Controlled variable setpoint to 2.0 g O2/m3 (maintained DO concentration),
- the Initial value of manipulated variable to 75000 Nm3/d (Input air flow of Reactor 2),
- the Minimum of manipulated variable to 30000 Nm3/d, and
- the Maximum of manipulated variable to 200000 Nm3/d.
Within the Gains menu set the Proportional gain to 50000, the Integral gain to 1000 and the Derivative gain to 125 (Figure 4.4.2).

Note: The proper tuning of the controller needs attention. In every situation, the best gains for the controller depend on the combination of the controlled and manipulated variable. In this case, the controlled variable is set to 2, while the manipulated variable can change between 30,000 and 200,000. Properly operated controllers react quickly to the change of the controlled variable, depending on the inertia of the system. As a rule of thumb, the gain is related to the MV/CV ratio. The proportional gain in this specific case should turn the error derived from small numbers (DO) into large air flow ranges. As it was seen at the Continuous P controller, if both the controlled and the manipulated variables are in the same range, the most suitable proportional gain will be a small number.
Note: Controllers use units for the controlled and manipulated variable from the internal code of the system (called “in code unit”). To make sure that the controller is set up properly, change the Unit systems in the Options menu to “in code”, so that on the Inputs tab the respective units for the controlled and the manipulated variables can be verified.
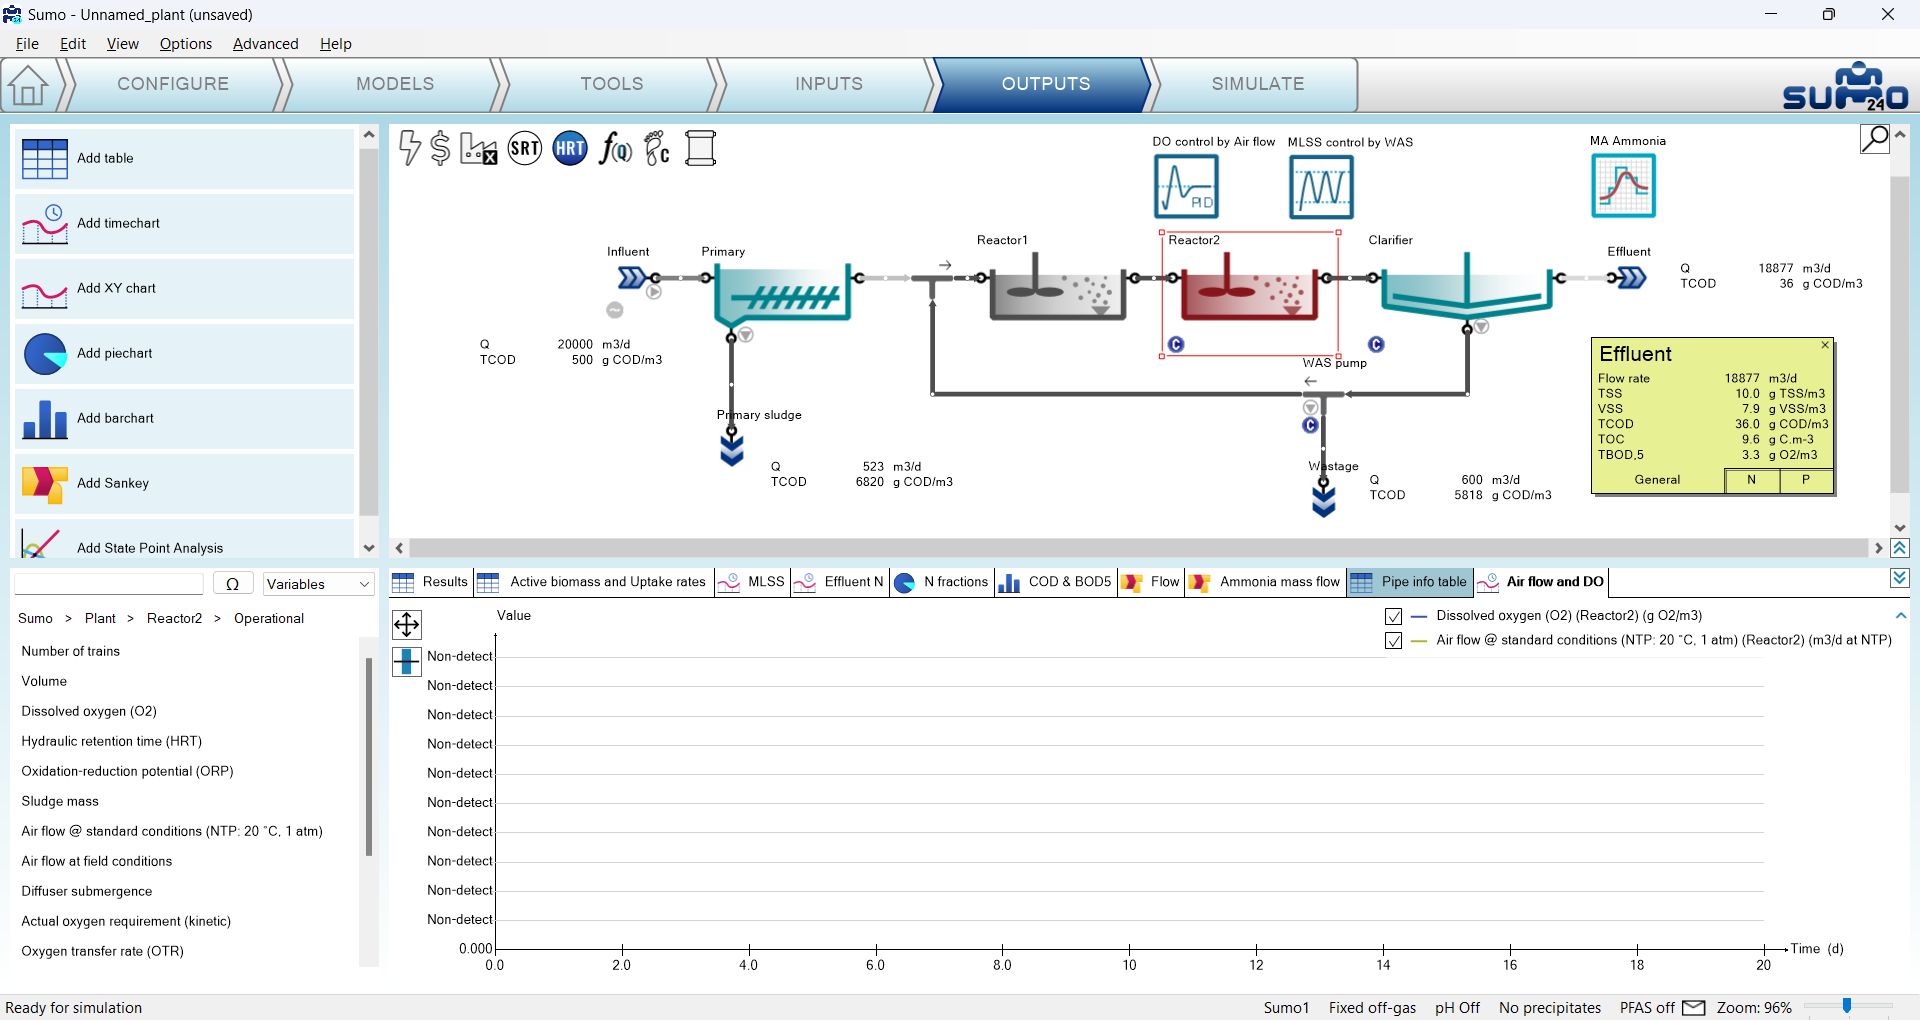
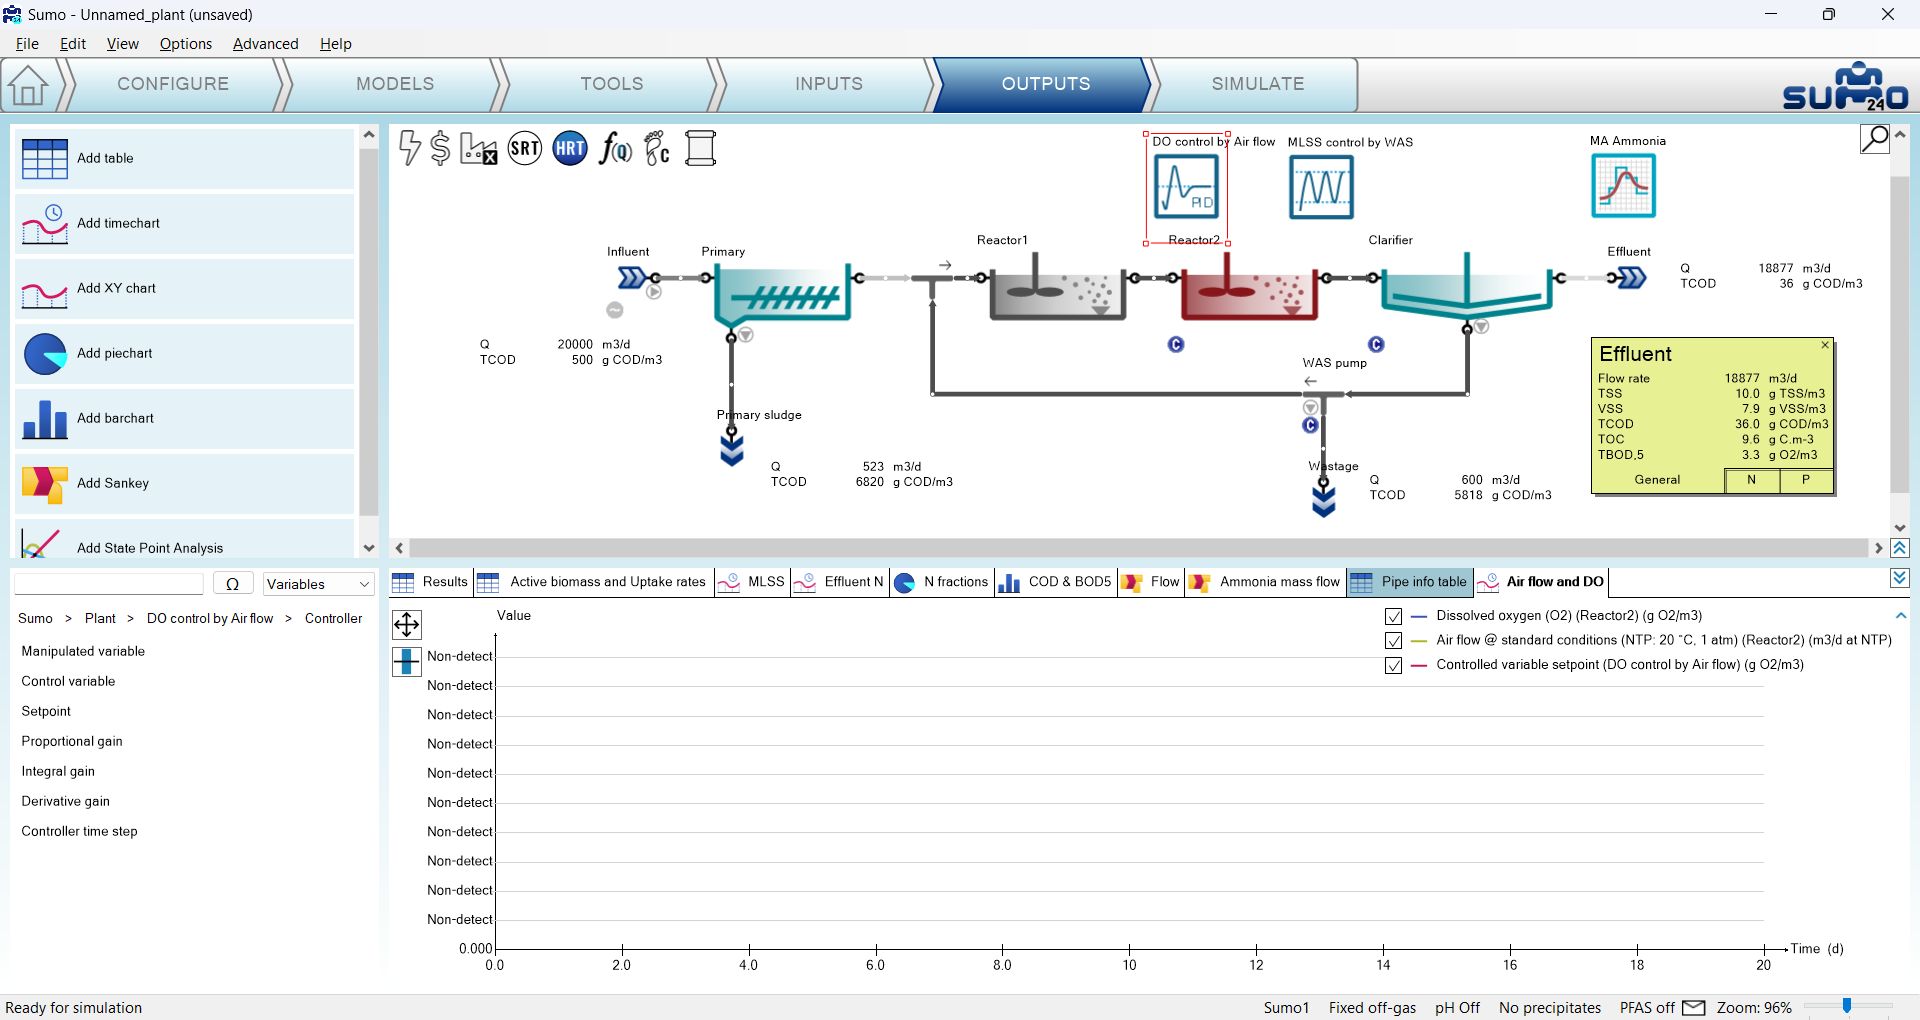
To follow the changes in the aeration of Reactor 2, add a timechart in the Outputs tab and rename it to “Air flow and DO”. Select Reactor 2 and drop Dissolved oxygen and Air flow @ standard conditions from Operational menu (Figure 4.4.3). Then select the DO control by Air flow controller and add the Setpoint from the Controller group (Figure 4.4.4).
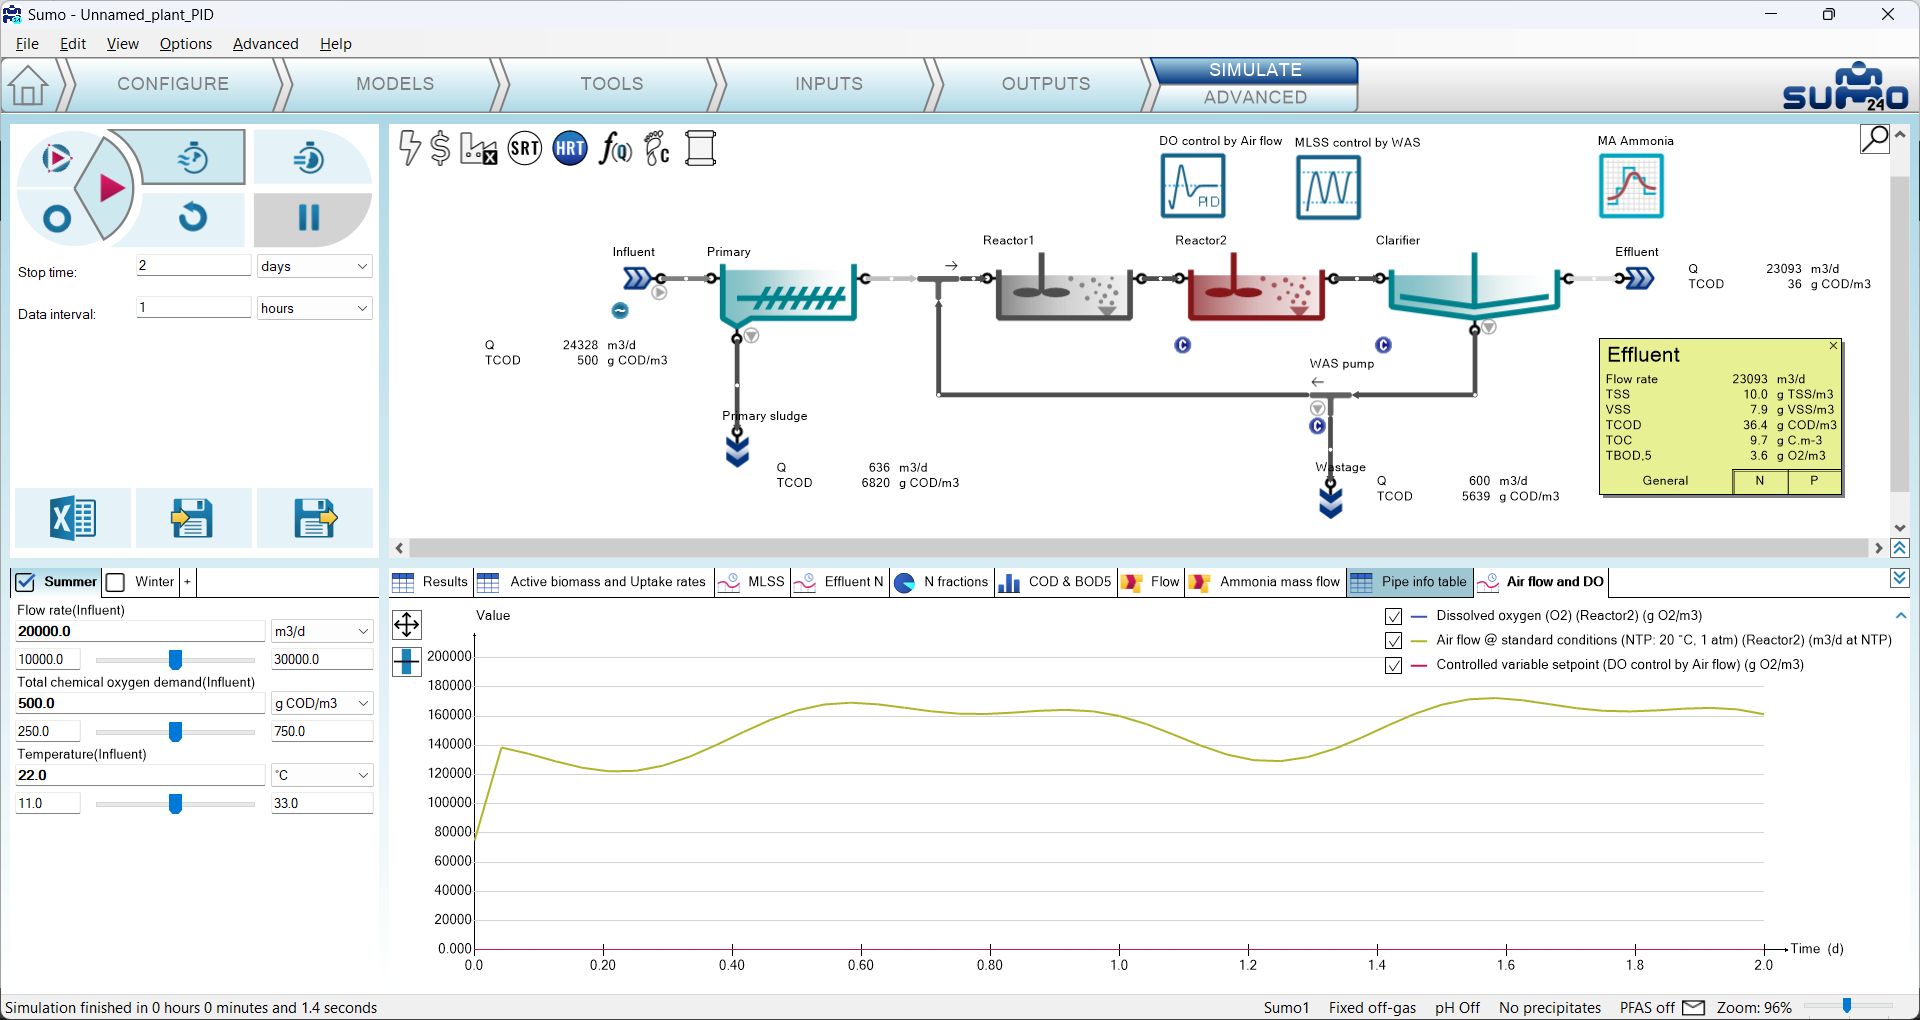
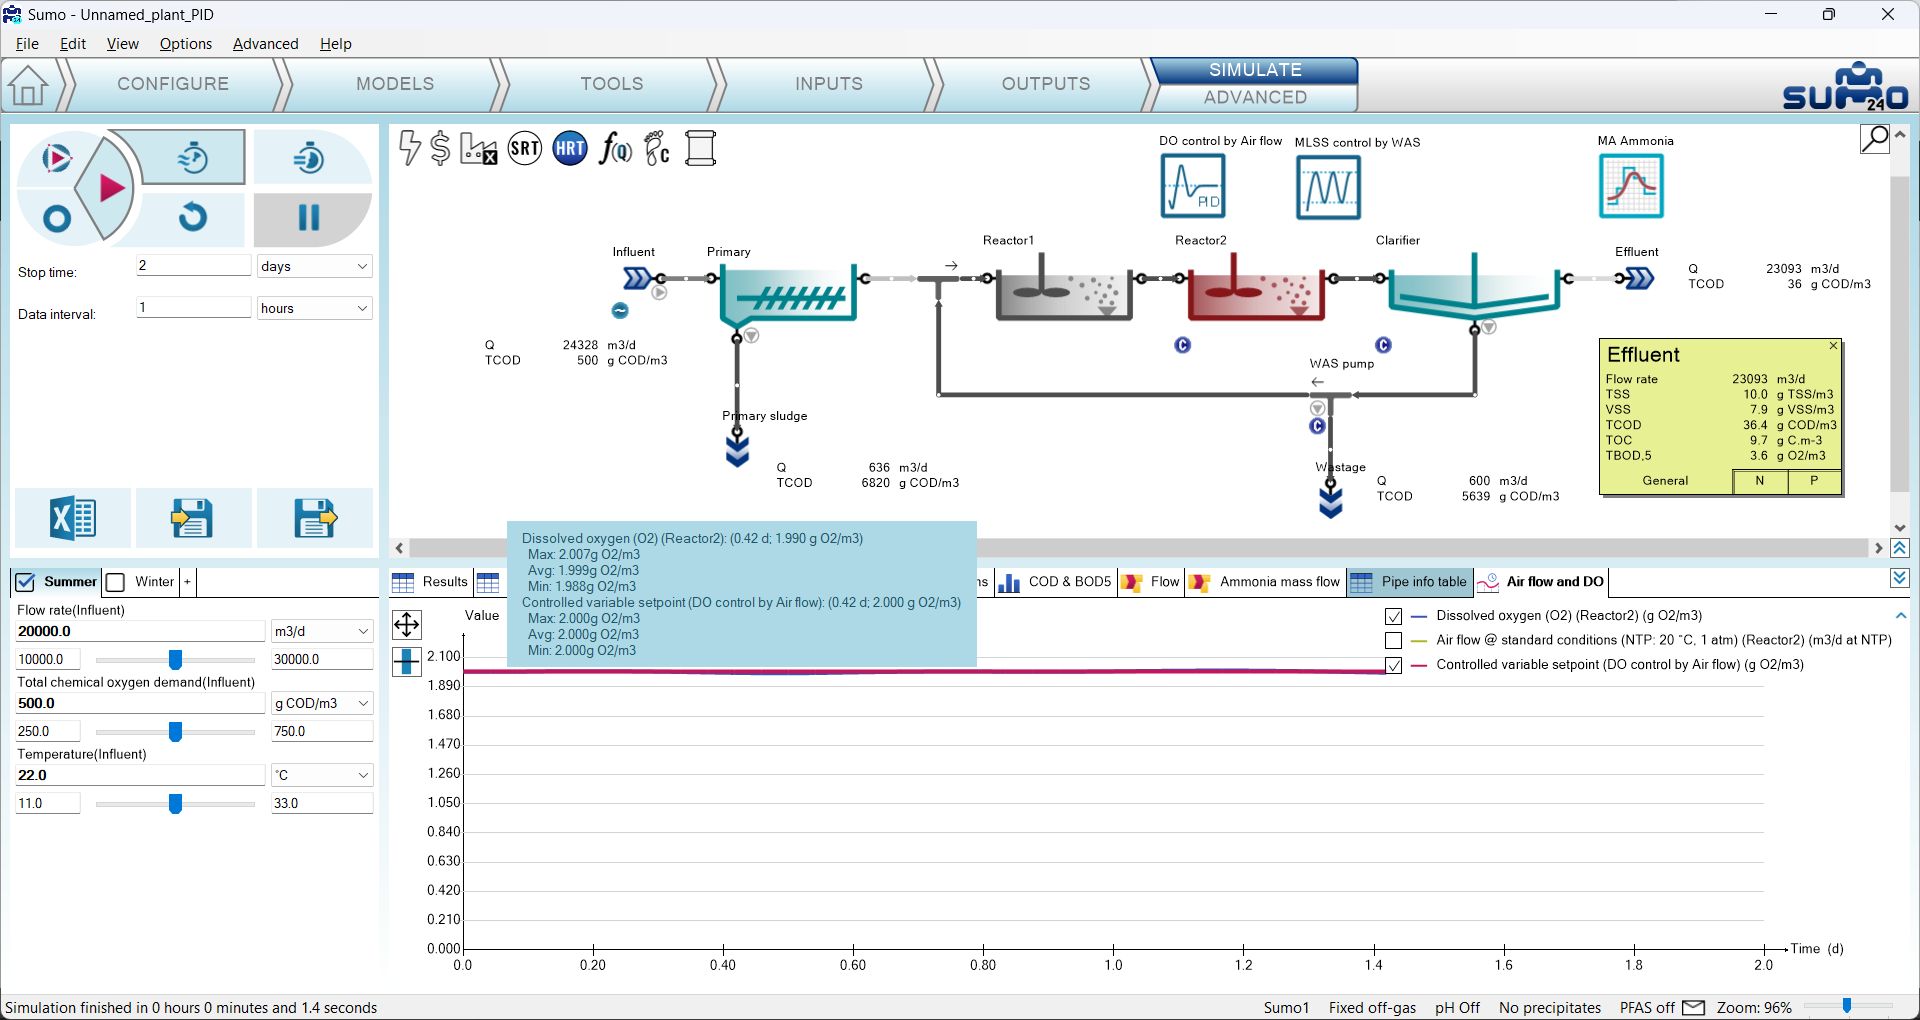
Enable the Diurnal flow dynamic input table for the Influent on the Inputs/Dynamics tab, then go to the Simulate tab and set the stop time to 2 days, then run a dynamic simulation. During the calculation, you can follow the change of the air flow on the Air flow and DO timechart (Figure 4.4.5). Unchecking the Air flow item on the timechart, only the dissolved oxygen setpoint and the predicted DO will be shown (Figure 4.4.6). Using these gain settings, the controller can keep a strict fit to the setpoint without oscillation or overshoot (this can be verified by hovering the mouse on the graph and checking the values on the popup that appears on the timechart).
Note: It is good to keep in mind that this plant is subjected to dynamic influent load and a Deadband MLSS controller, thus the system never reaches steady state conditions.
¶ Ratio controller
The Ratio controller is using a ratio as multiplier for the manipulated variable, thus keeping the ratio of the manipulated and the control variable constant during the operation of the facility. To test this function, add a Carbon dosage unit (choose the mass flow based & methanol options) using a flow combiner before Reactor 1 of the example project, as shown by Figure 4.5.1 (renaming the new unit to “Methanol dosage”).
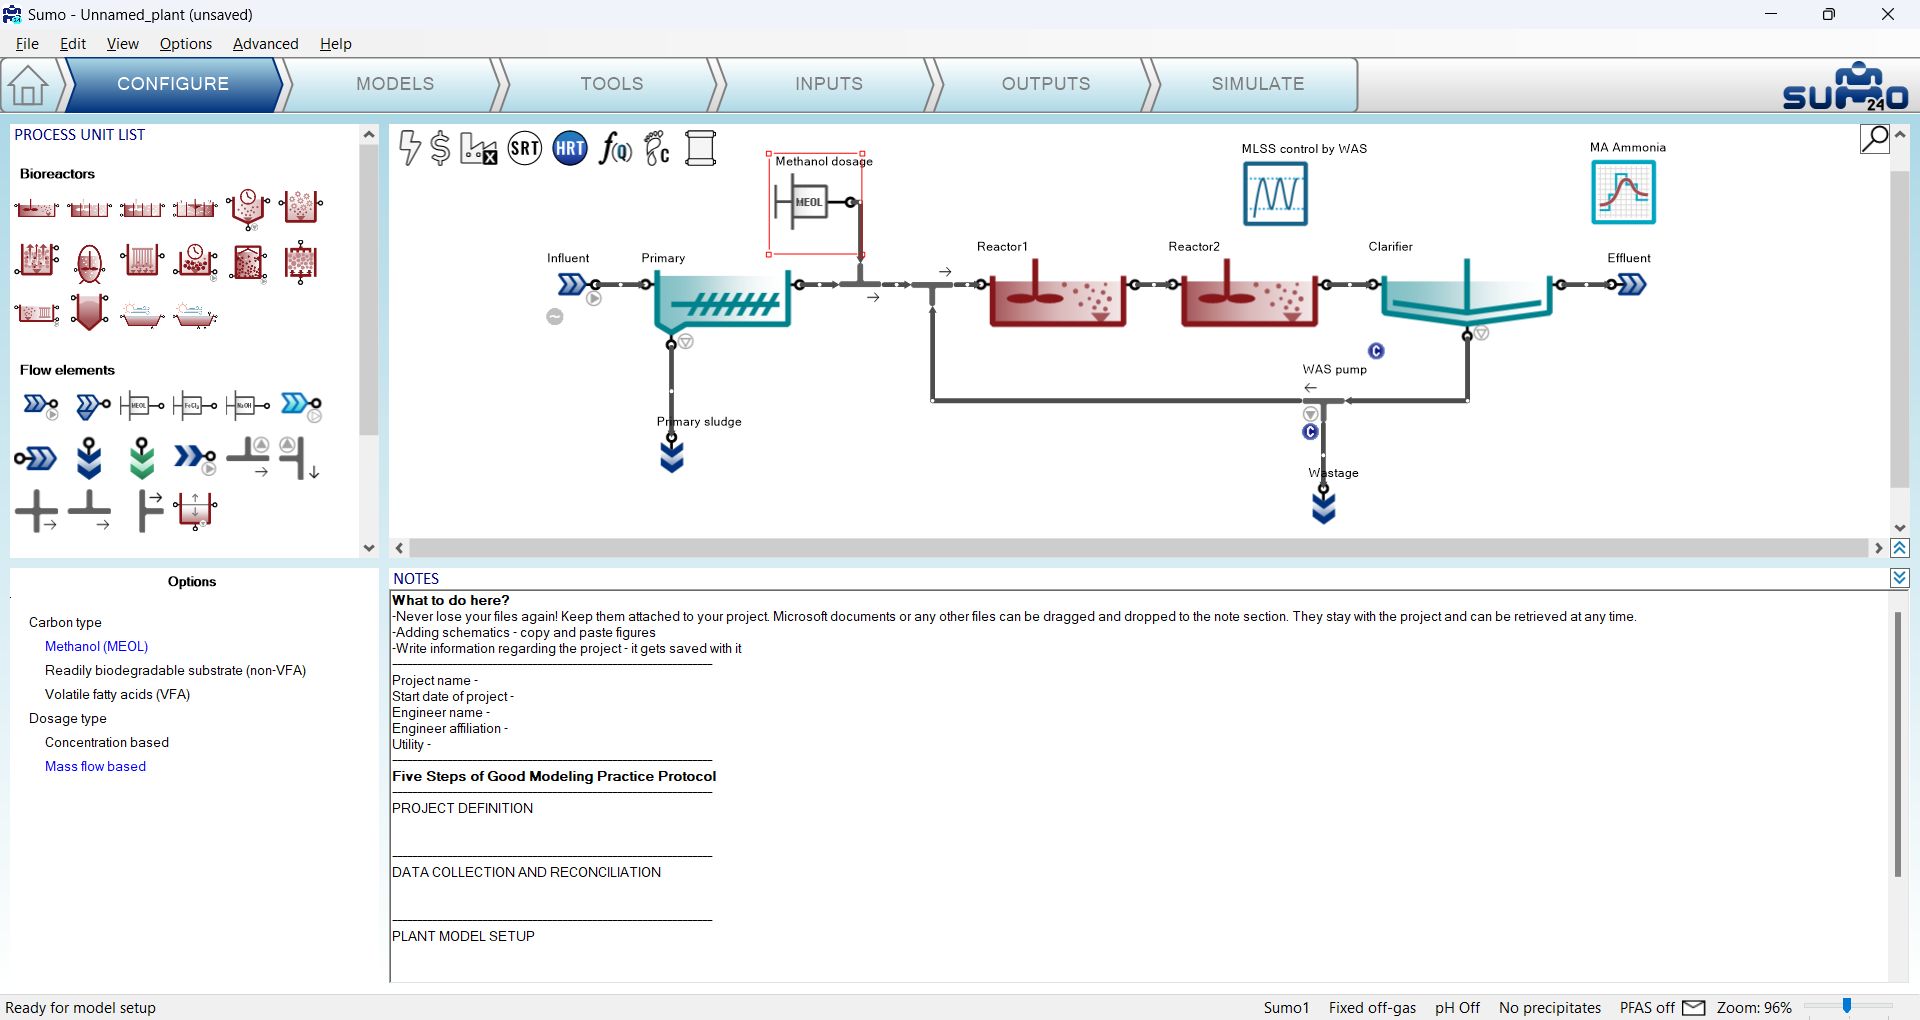
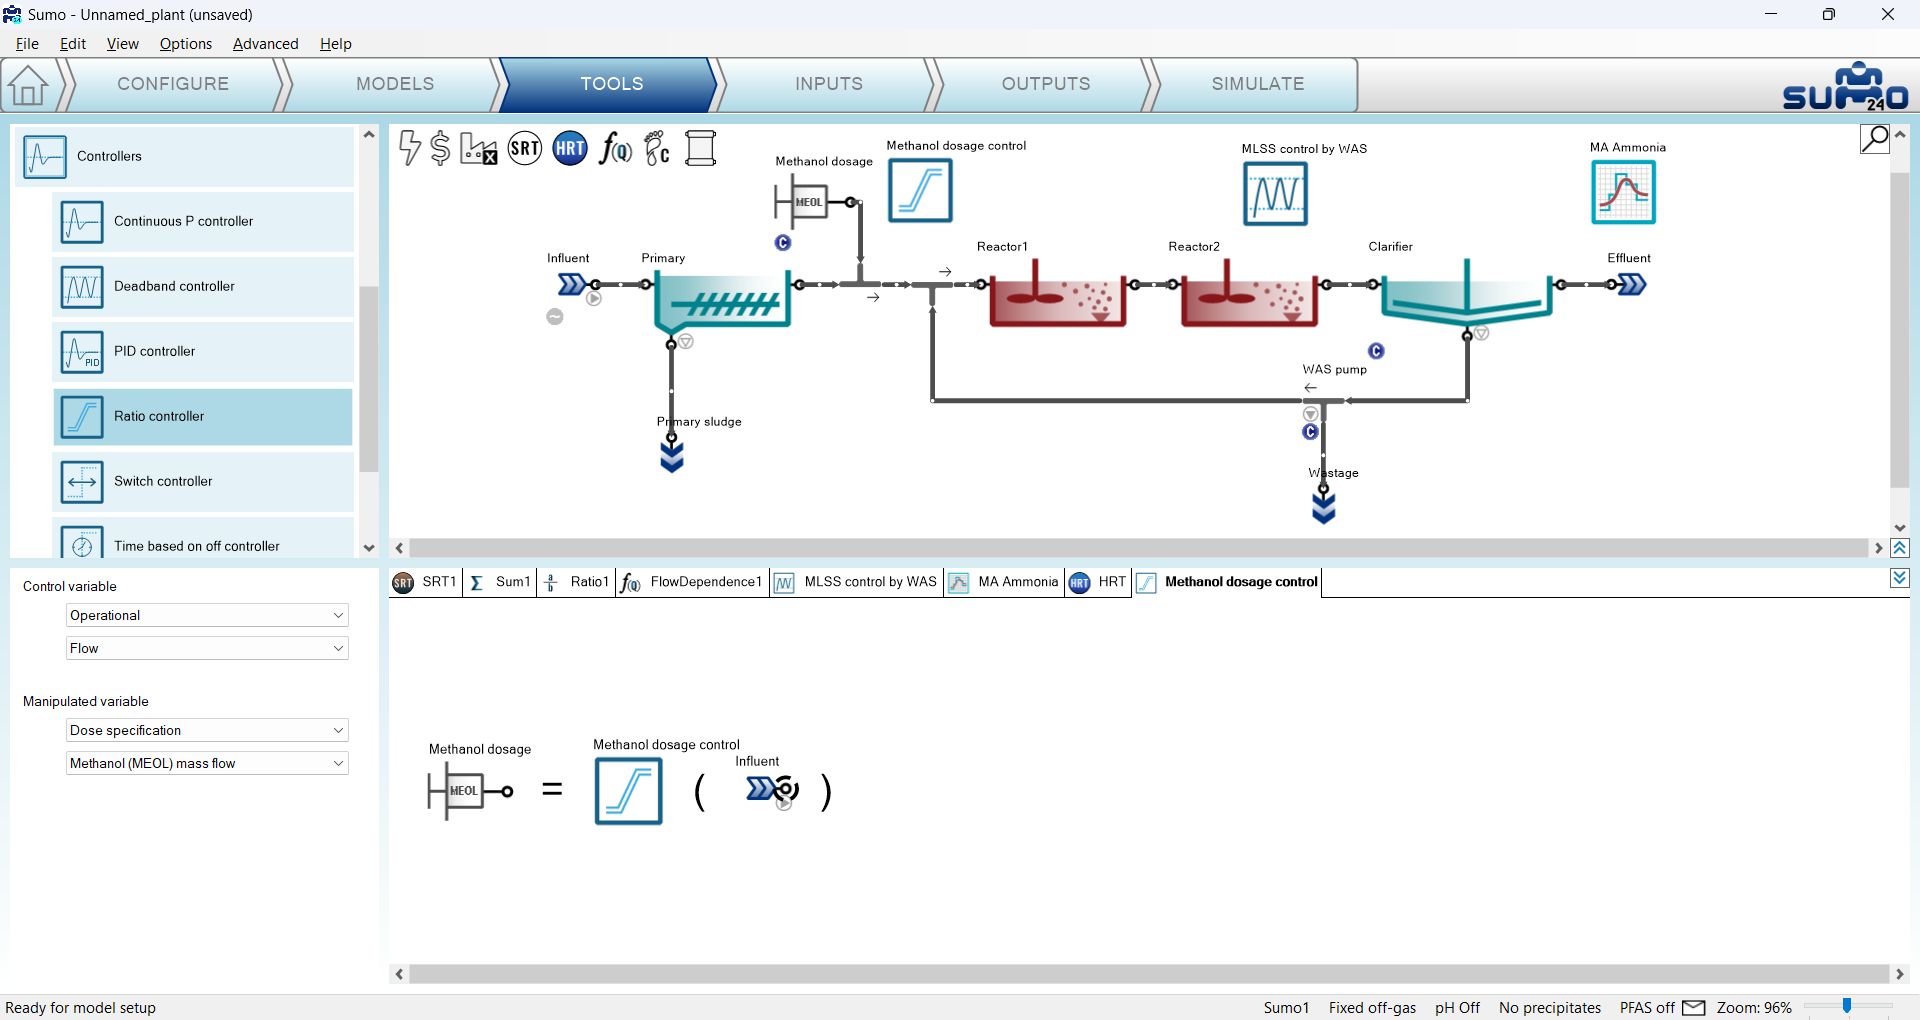
Now add the Ratio controller from the Tools tab and proceed as follows: first drag and drop the manipulated unit (Methanol dosage) to the left side of the equation on the bottom right screen panel and the control unit (Influent) to the right side of the of the equation. On the bottom left screen panel, you can now select the control variable and the manipulated variable of the selected units. In this example, we will manipulate the methanol dosage unit mass flow rate, depending on the ratio to the influent flow rate. Rename the controller (using F2 or right click) to “Methanol dosage control” (Figure 4.5.2).
To properly set the controller parameters, the Unit system selection should now be turned to “in code” in the Options menu > Unit systems. On the Inputs tab, once the model has compiled, select the Methanol dosage and check the Unit of the mass flow – it is g COD/d (Figure 4.5.3). Select the new Methanol dosage controller. In the Ratio controller parameters table set the Ratio to 50, thus every influent m3 wastewater triggers 50 g of COD equivalent methanol dosage. Set the Minimum value of manipulated variable to 0, the Maximum value to 2.844E07 (equals the capacity of a dosage pump of 1 m3/h) and the Initial value to 1000000 (Figure 4.5.3). Turn on the dynamic input table for the Influent and leave other settings as they were set previously (Figure 4.5.3).

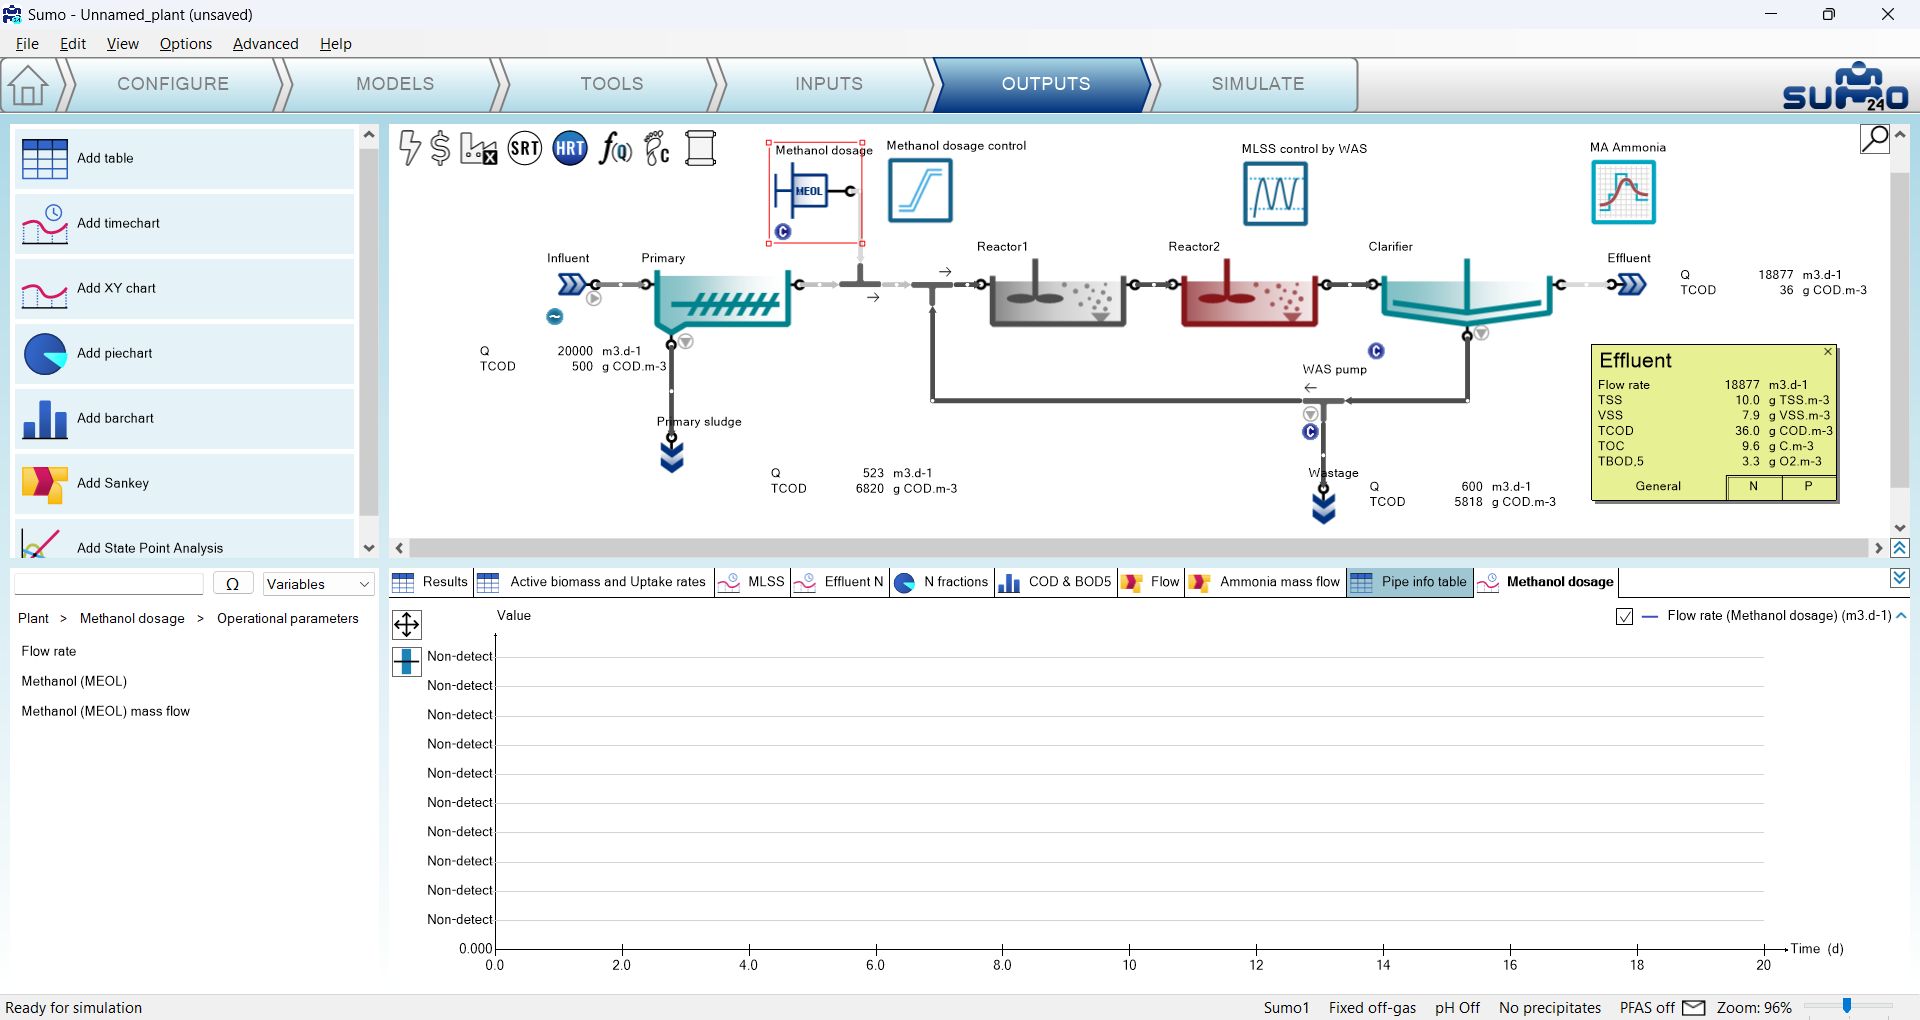
To follow the change of the Methanol dosage before Reactor 1, add a timechart on the Outputs tab and name it as “Methanol dosage”. Select the Methanol dosage process unit and drop Flow rate from the Operational parameters group (Figure 4.5.4).
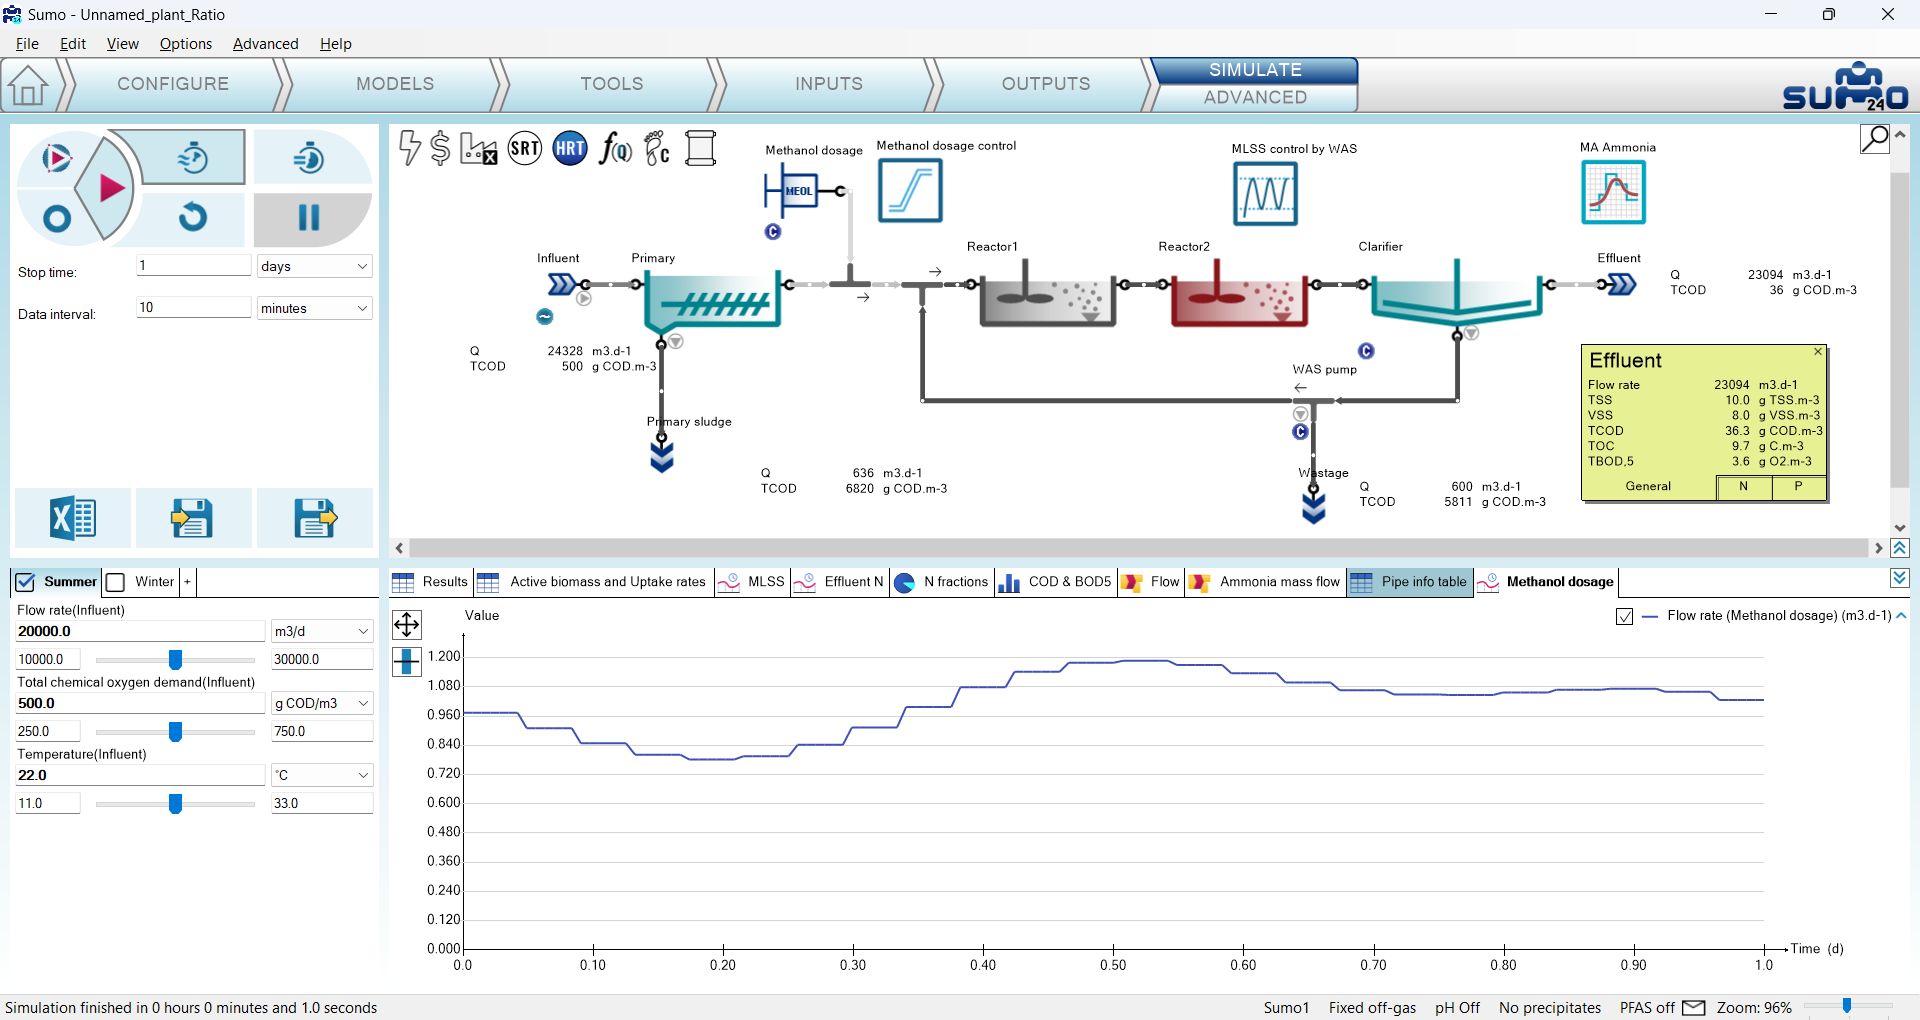
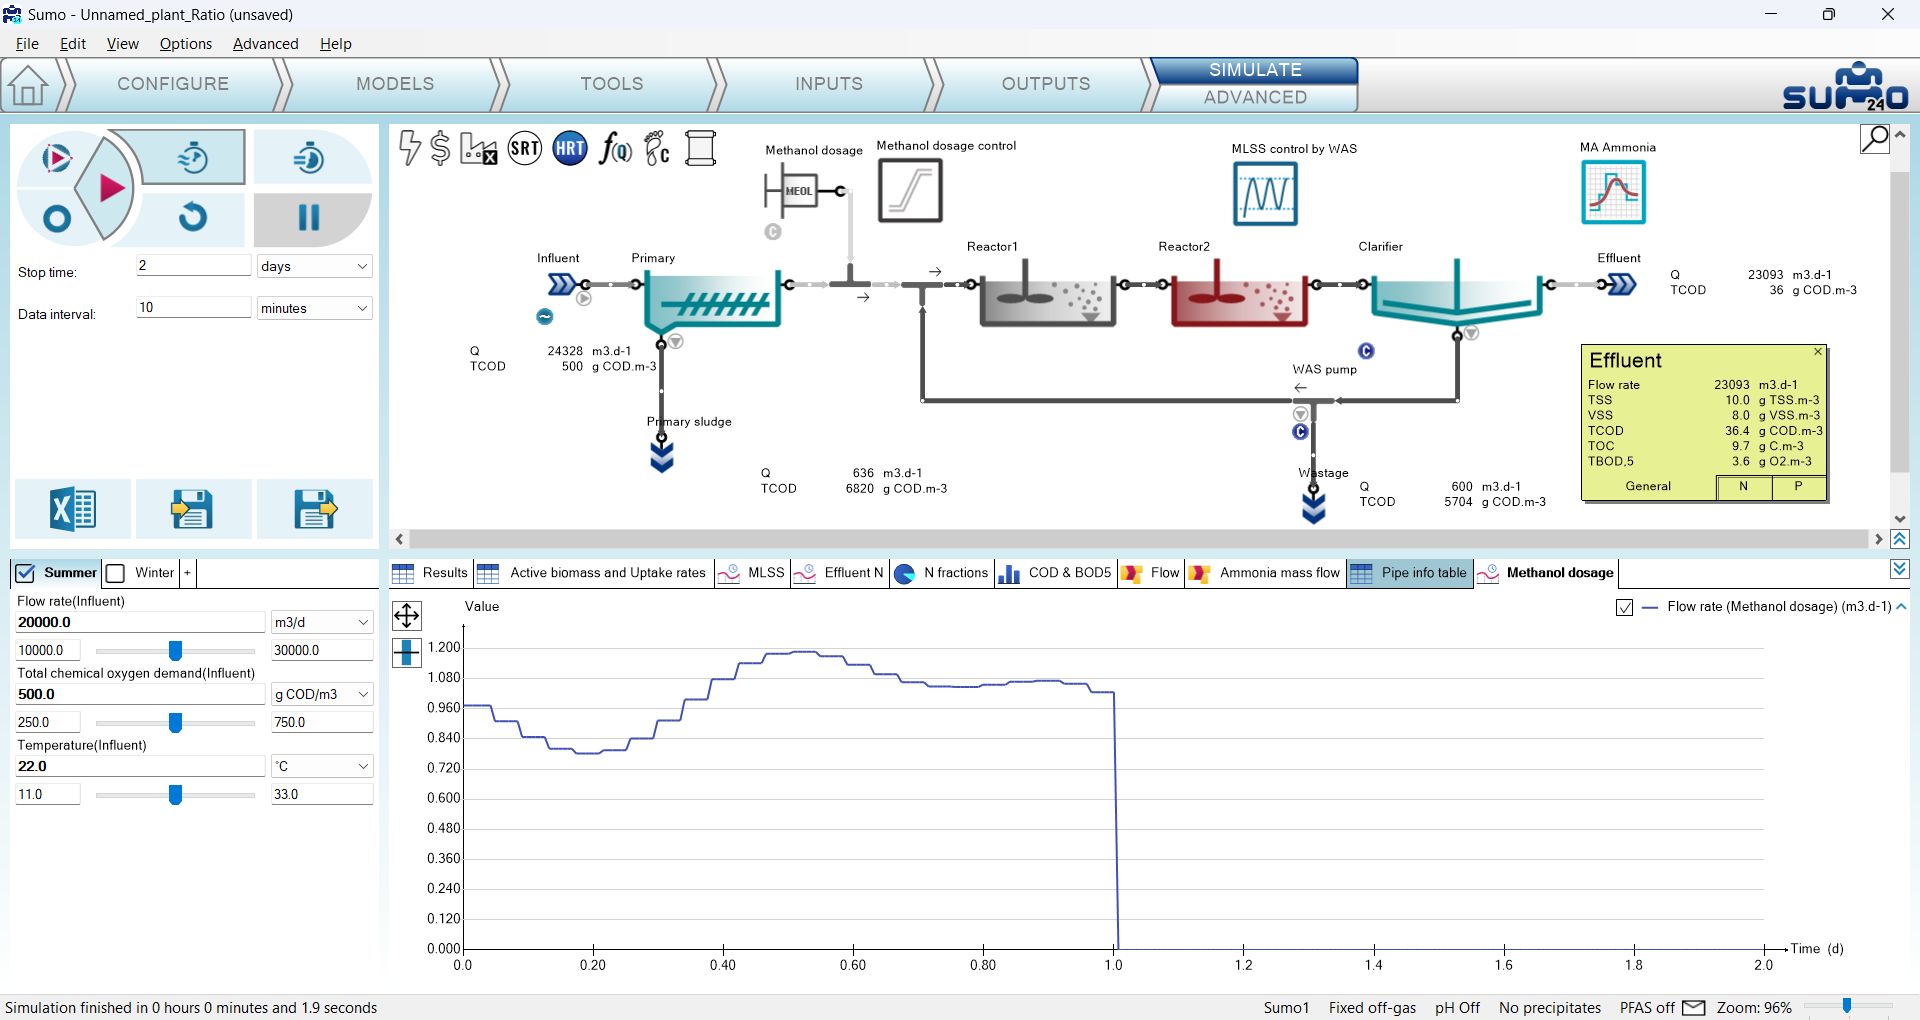
Go to the Simulate tab, set the stop time to 1 day with a data interval of 10 min and run a dynamic simulation. You can follow on the Methanol dosage timechart how the methanol dosage flow rate changes during the calculation, responding to the diurnal flow (Figure 4.5.5).
Now go to the Inputs and set the Controller on-off flag to FALSE (you can simply type "0" to achieve this) for the Methanol dosage control unit (Figure 4.5.6).

Go to the Simulate tab, increase the stop time to 2 days and hit Continue. The flow rate of the methanol dosage pump will drop to 0 m3/d (Figure 4.5.7), which corresponds to the value given at the Inputs/Constants tab as 0 g COD/d dosage rate. Note that the GUI turns the controller color to grey in order to inform the user that it is turned off.
¶ Time based on-off controller
The Time based on-off controller is a controller that sets the input parameter (manipulated variable) of the desired process unit based on a time step between a defined high and low value. This controller has no measured variable input (no control variable).
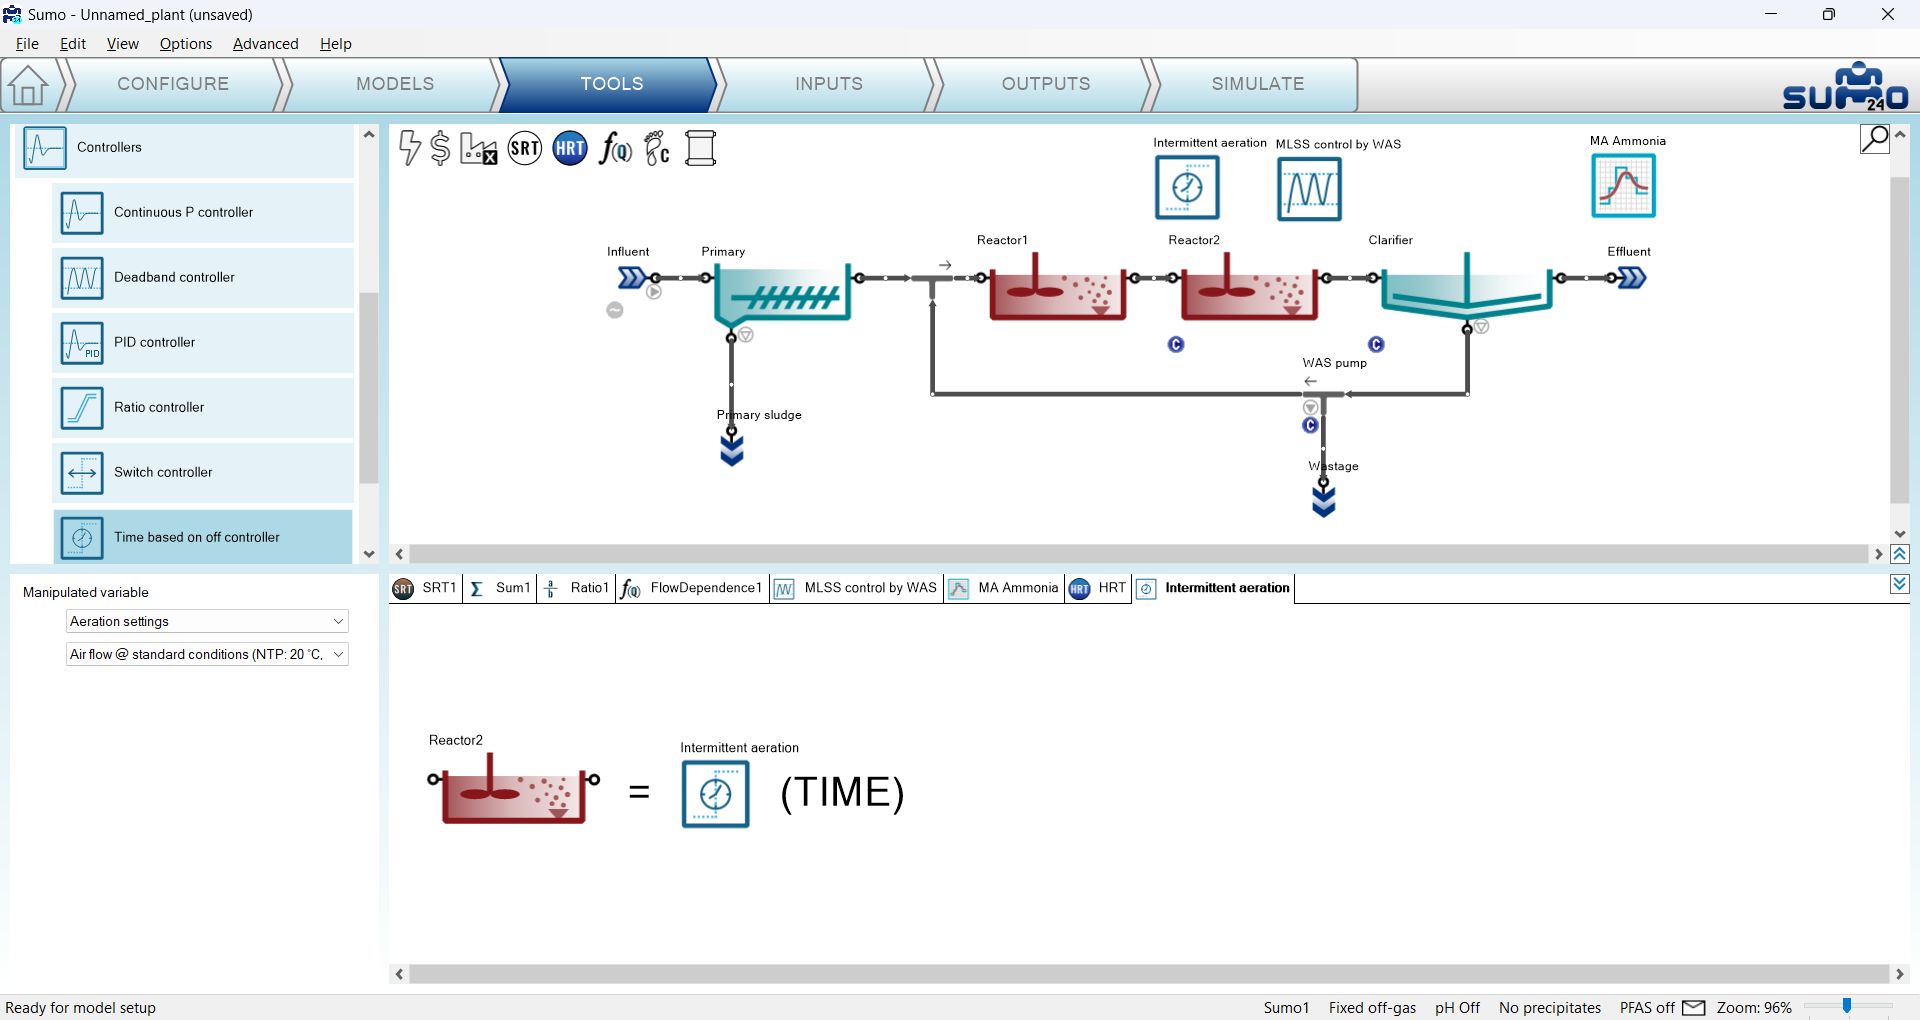
To demonstrate the capabilities of this controller, let us set Reactor 2 to use the Calculated option for Dissolved oxygen (Configure tab). Then add the controller and configure on the Tools tab as follows. First drag and drop the manipulated process unit (Reactor 2) to the left side of the equation in the bottom right screen panel. On the bottom left screen panel, you can now select the manipulated parameter of the selected unit. In this example, we will generate intermittent aeration in the chosen reactor by changing the air flow (located under Aeration settings). Rename the controller (using F2 or right click) to “Intermittent aeration” (Figure 4.6.1). This will rename the tab as well.
On the Inputs tab, select the new Intermittent aeration controller and review the Time based on-off controller parameters table. Once the project has compiled, set the Cycle length to 1 h, the Duration while the manipulated variable is set to high parameter to 0.5 h (aeration will be turned on for 30 min) and the High value of the manipulated variable parameter to 250000 m3/d, leaving the other parameters at default (Figure 4.6.2).

Before moving on, also make sure that the diurnal flow dynamic input table is turned on for the influent.
To follow the changes in the aeration of Reactor 2, add a timechart on the Outputs tab and rename it to “Air flow and DO”. Select Reactor 2 and drop Dissolved oxygen and Input air flow from Operational menu (same method as described in the PID controller chapter, see Figure 4.4.3).
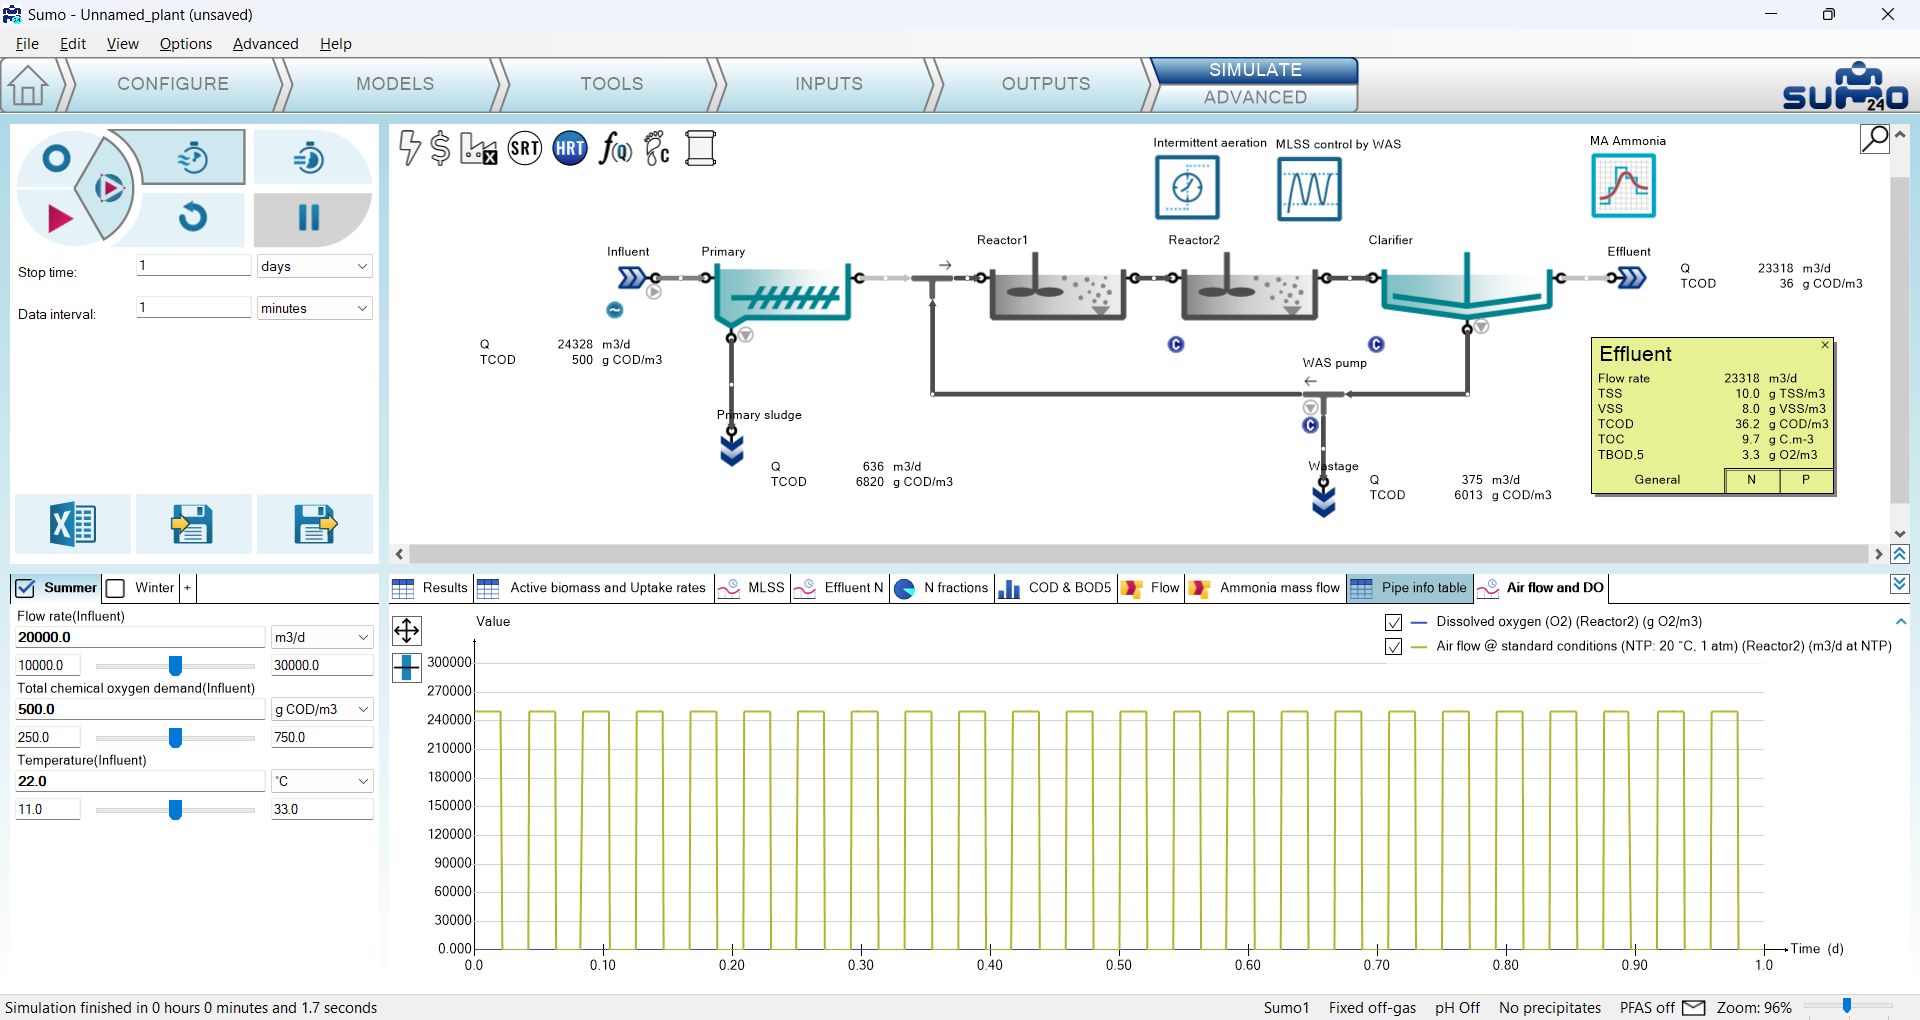
Now go to the Simulate tab, set the stop time to 1 day with 1 minute data interval and run a dynamic simulation from steady-state. During the calculation, you can follow the periodic changes in the air flow on the timechart (Figure 4.6.3).
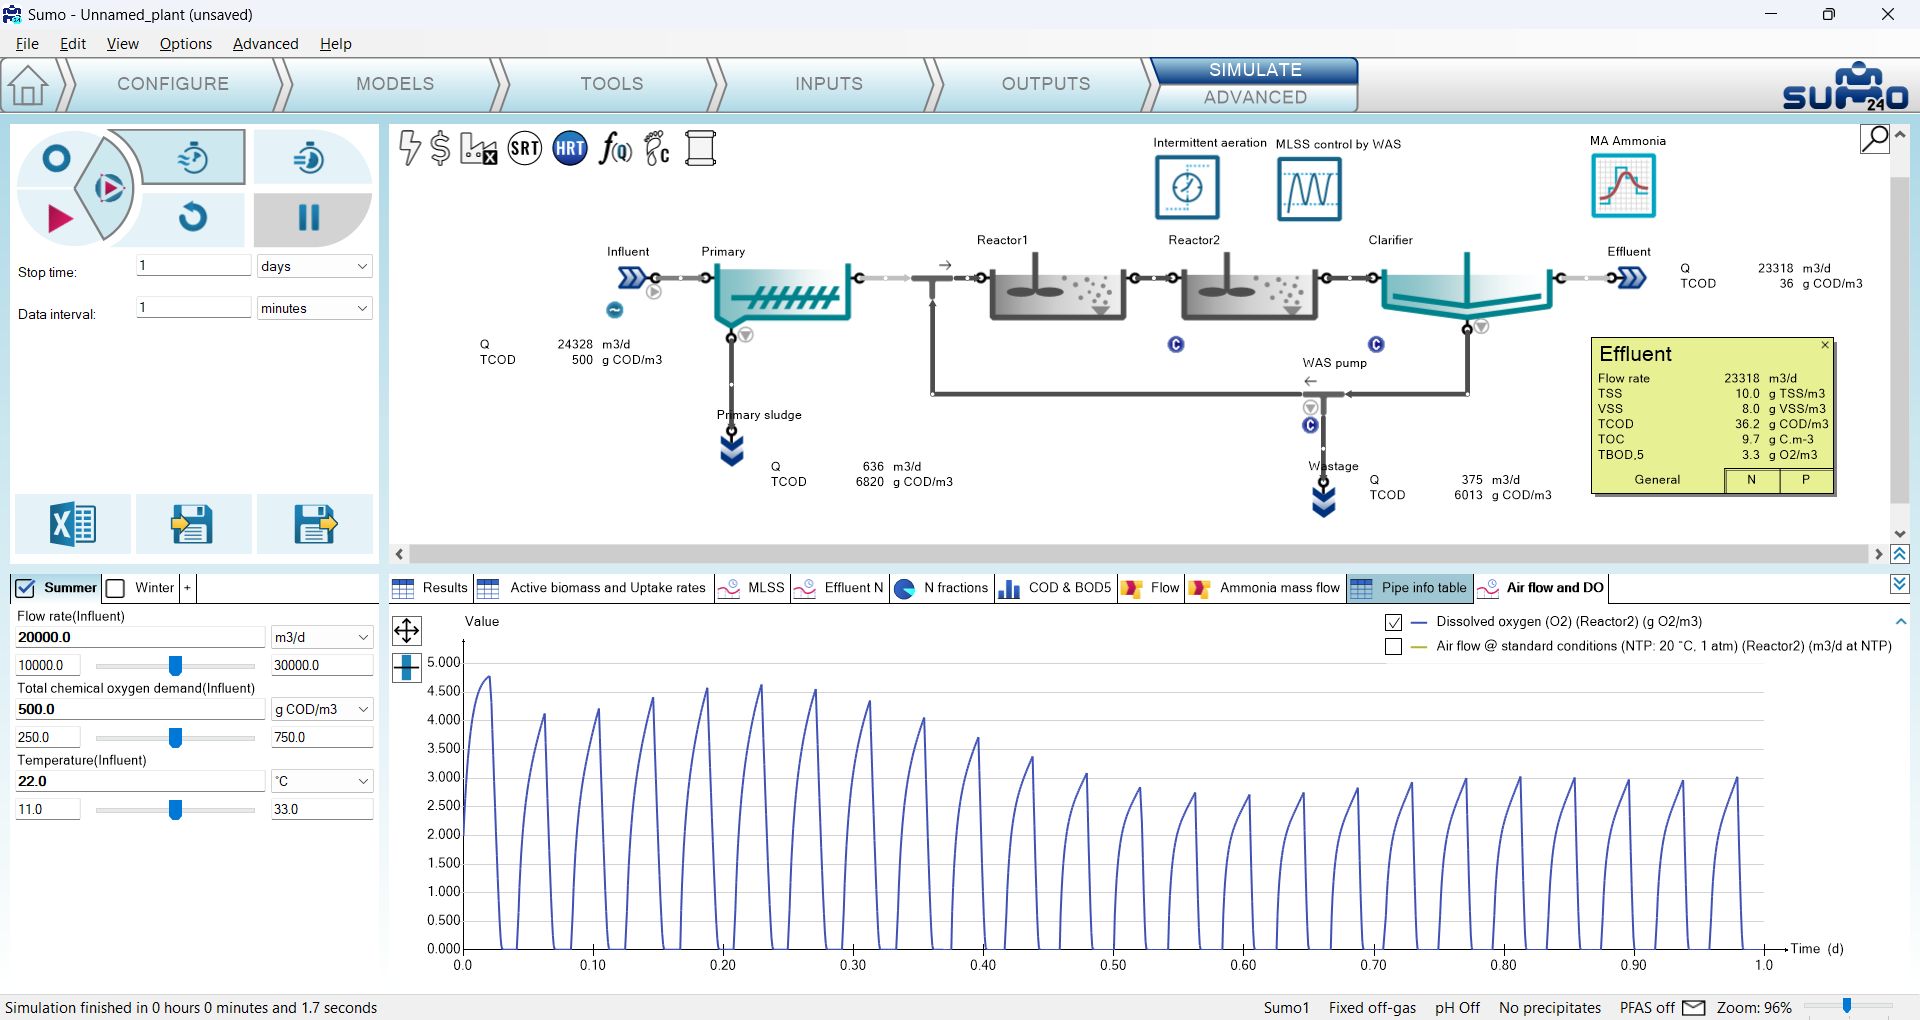
Unchecking the curve for the Air flow,in the legend, the resulting periodic changes in the dissolved oxygen can be seen in details. (Figure 4.6.4). The effect of the diurnal flow pattern can also be observed.
¶ Switch controller
The Switch controller is a controller that sets the input parameter (manipulated variable) of the desired process unit between two defined values (using an S-shaped logistic function), depending on whether the control variable is above or below a defined threshold.
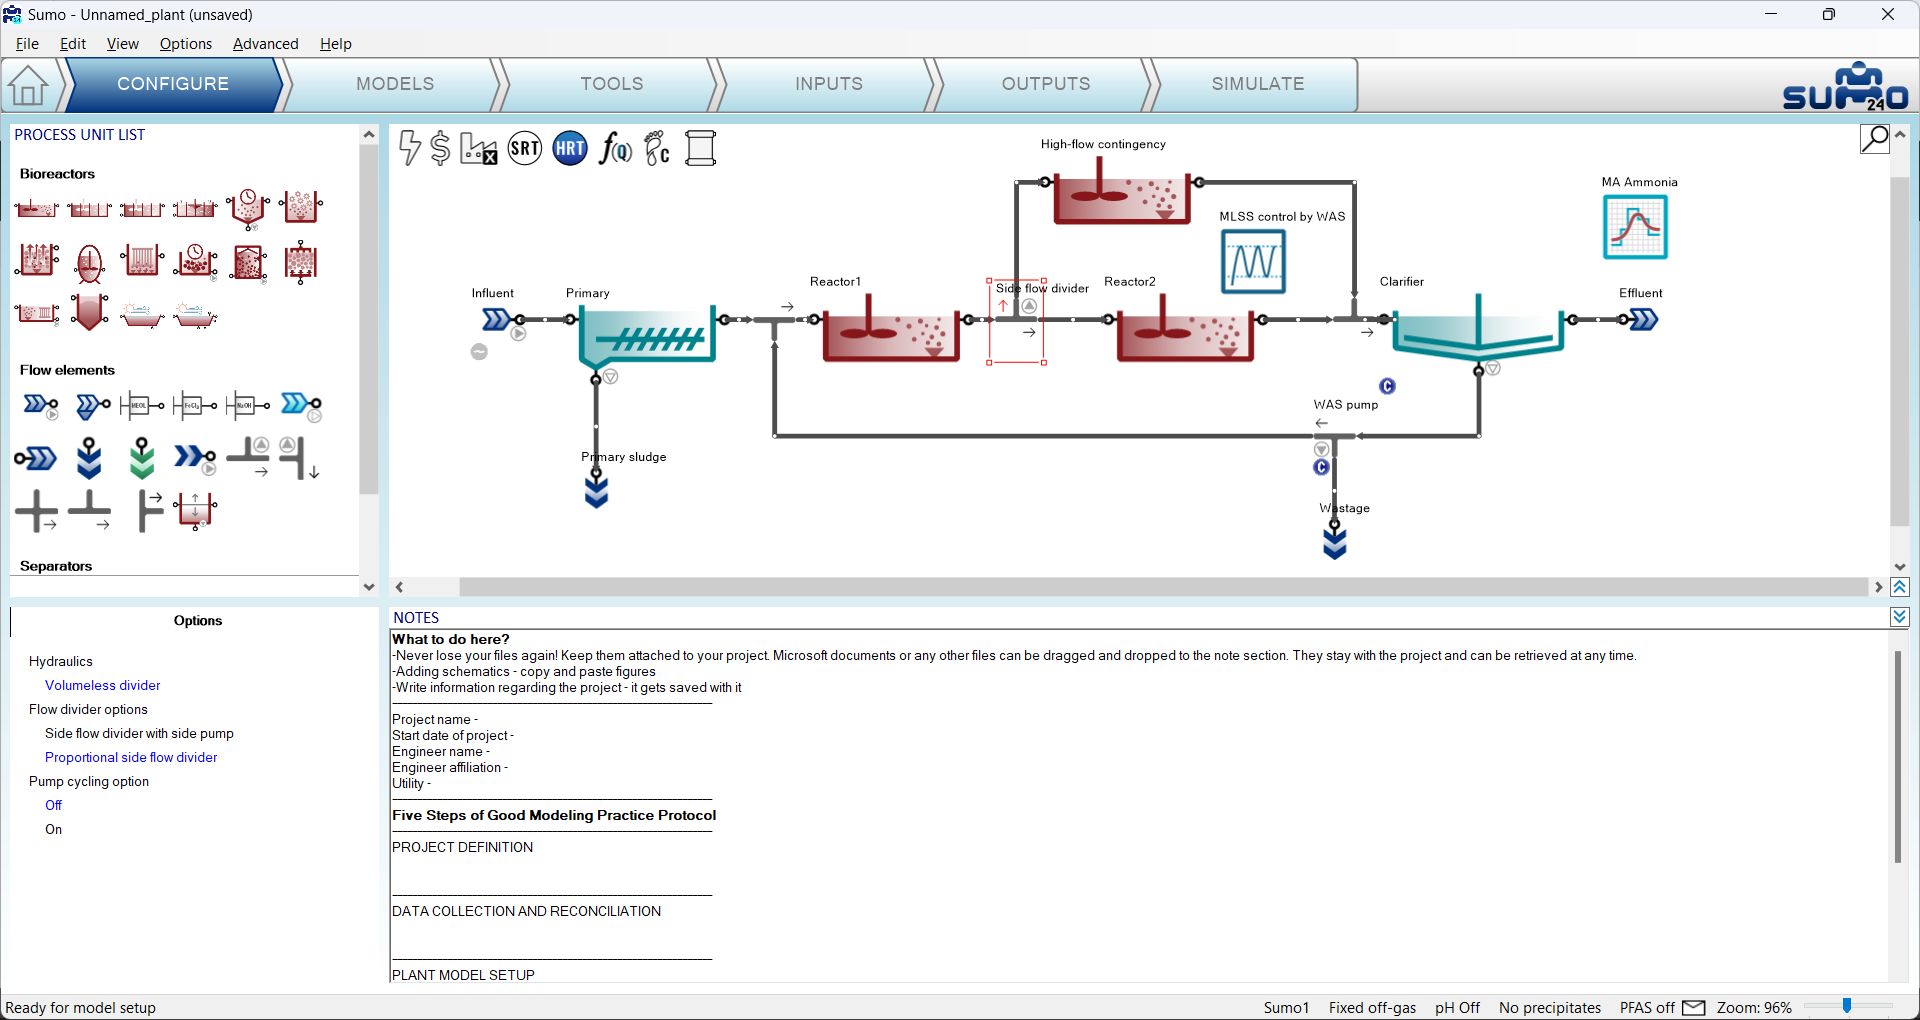
To demonstrate how this controller works, open the example project and extend it on the Configure tab as shown on Figure 4.7.1, by adding a parallel line to the aerated reactor. Make sure that for the side flow divider, the proportional option is selected, and the reactor has the input DO option (just like Reactor 2). Rename the new reactor to “High-flow contingency”. The role of this extension is to add extra capacity for treating wet weather flows.
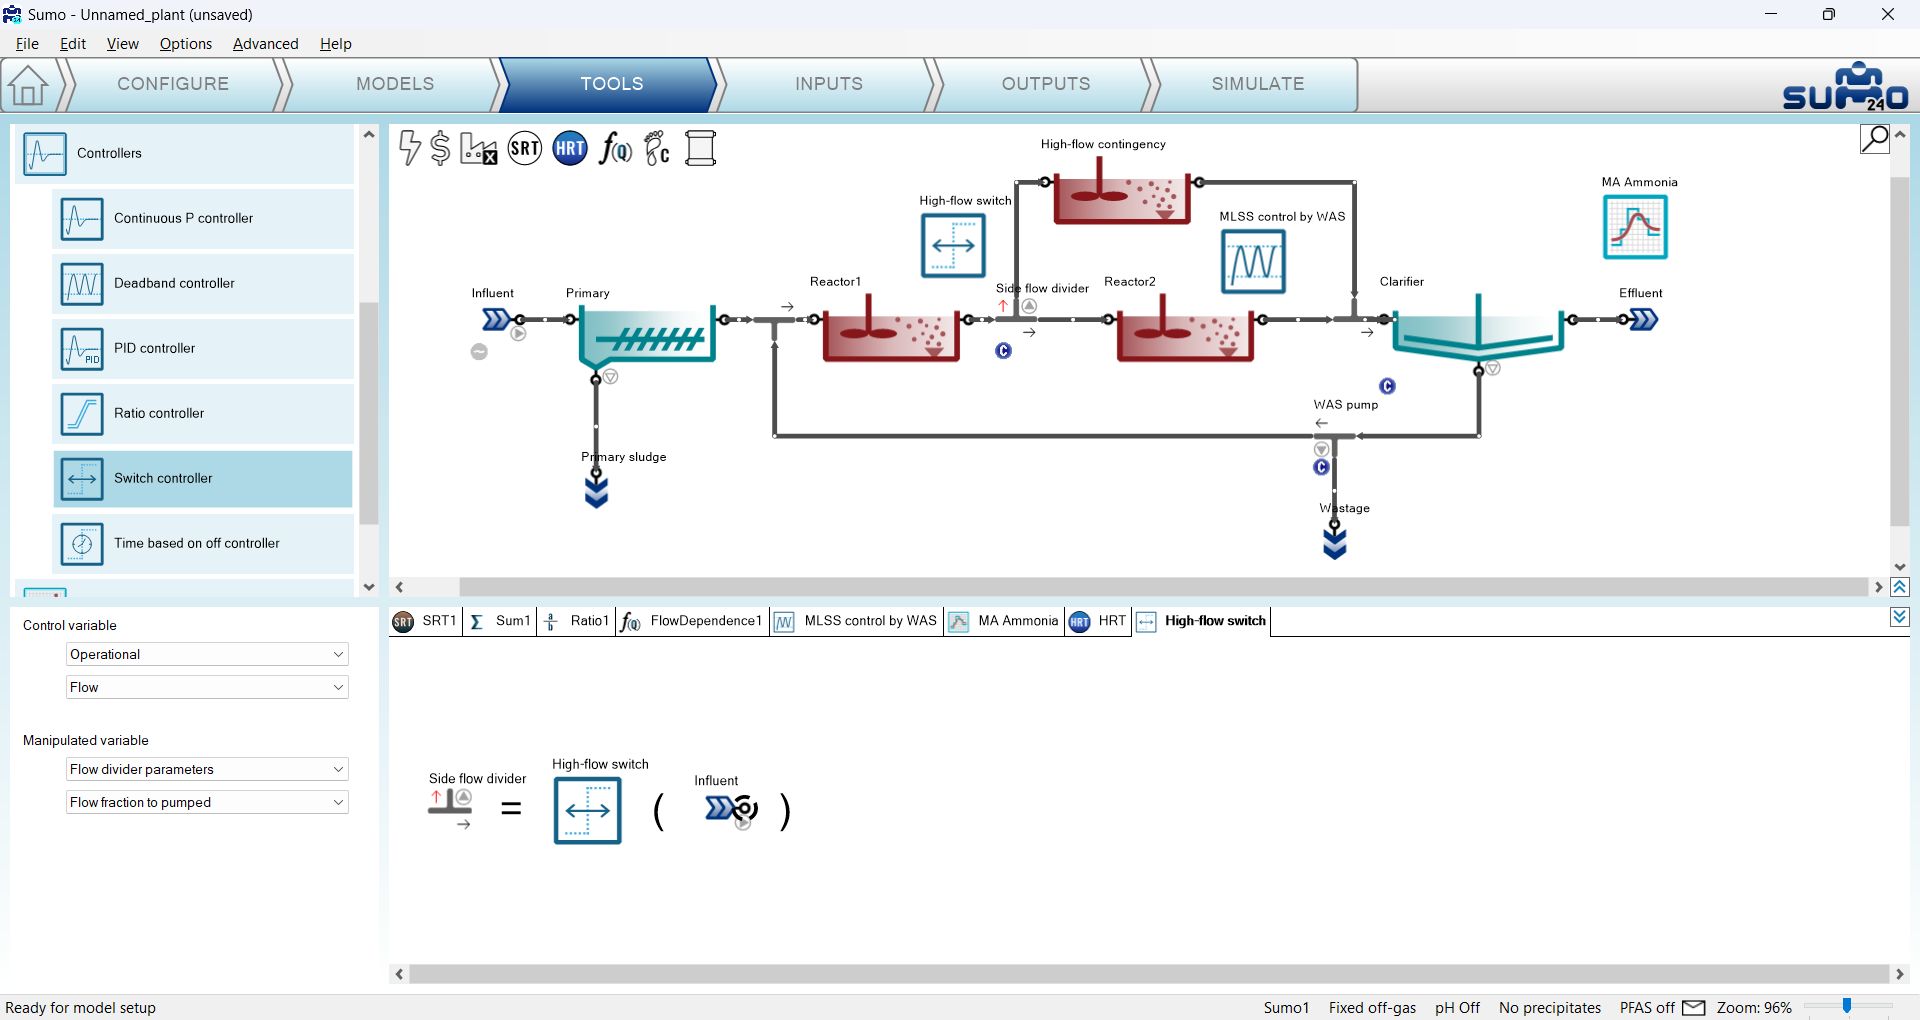
Then add the controller on the Tools tab and configure it according to the following. First drag and drop the manipulated process unit (Side flow divider) to the left side of the equation in the bottom right screen panel, then drag and drop the control unit (Influent) to the right side of the equation. On the bottom left screen panel, select Flow from the Operational as control variable and select Flow fraction to pumped (located under Flow divider parameters) as the manipulated parameter. We will use this controller to split the flow evenly between Reactor 2 and the High-flow contingency reactor if the infuent flow exceeds a certain limit, while keep the contingency reactor off-line when the incoming flow to the plant is below this threshold. Rename the controller (using F2 or right click) to “High-flow switch”. This will rename the tab as well (Figure 4.7.2).
On the Inputs tab, set the Volume per train parameter of the High-flow contingency reactor to 8000 m3, the Flow fraction to pumped parameter of the side flow divider to 0% (this value will be used if the controller is disabled) and review the settings of the controller parameters table for the new High-flow switch controller as follows: set the Controlled variable threshold to 30000 m3/d and the Value of manipulated variable above threshold parameter to 50%; leave all other parameters at default (Figure 4.7.3).

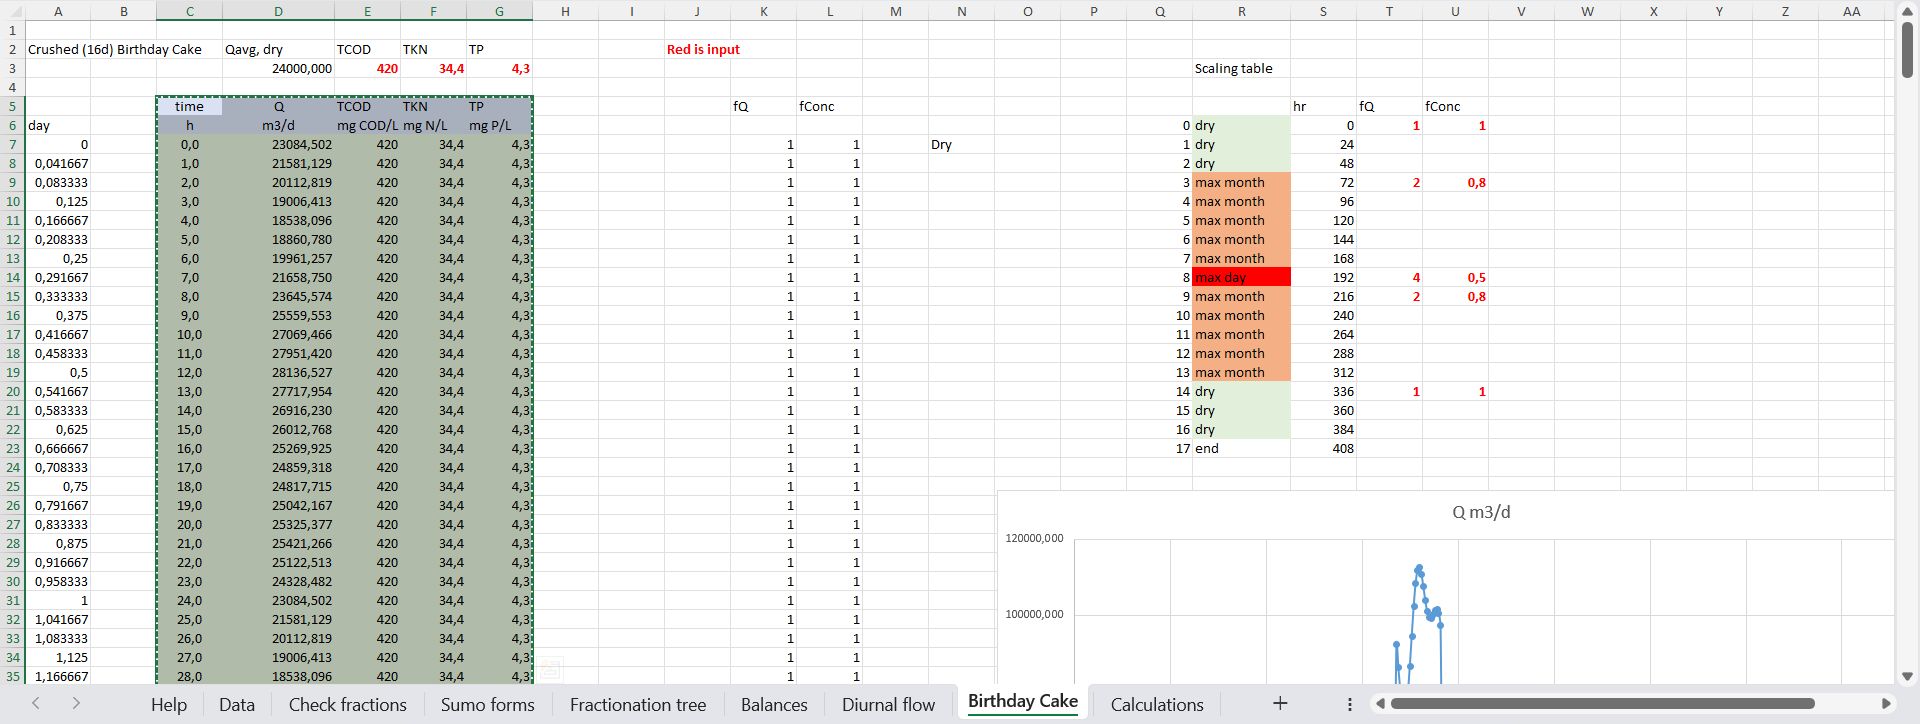
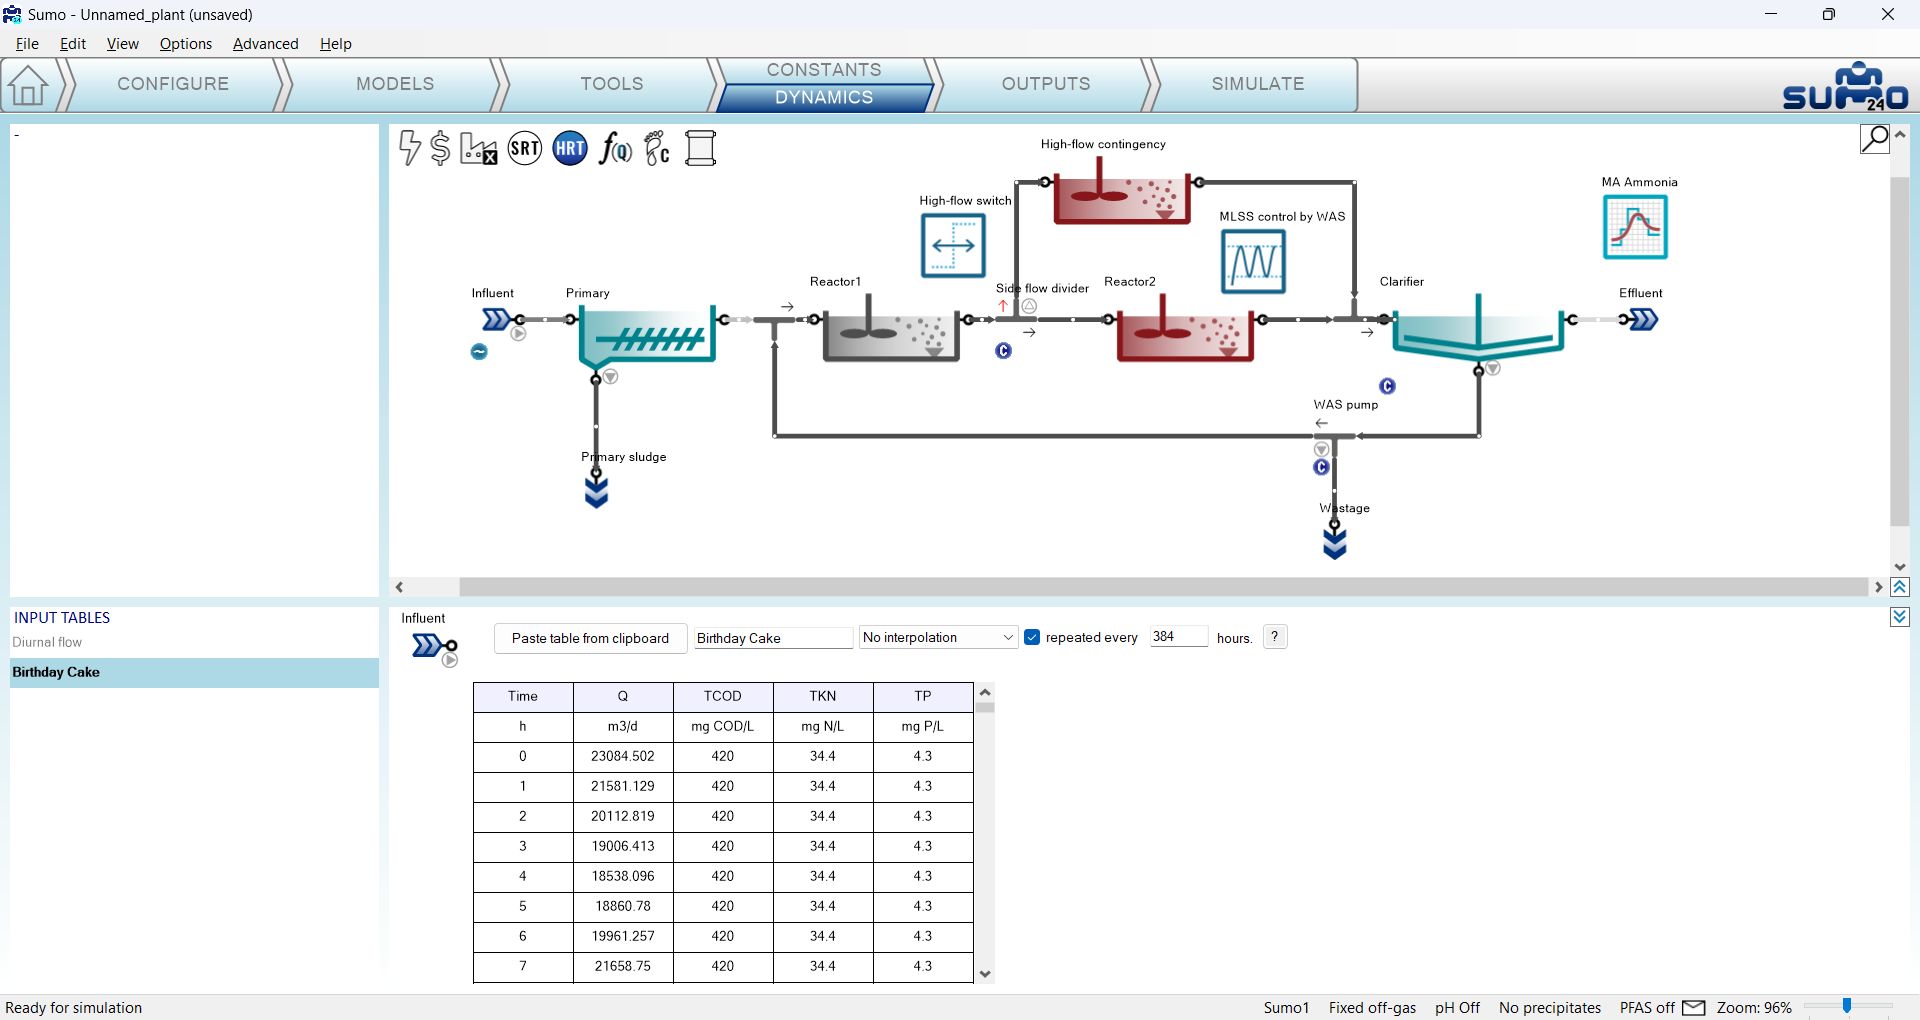
For this exercise, leave the diurnal flow dynamic input table for the influent turned off. Instead, open the Influent tool (remember you will have to select the Influent unit first) and navigate to the sheet called “Birthday Cake” (Figure 4.7.4). This sheet contains of hourly influent data spanning over 16-days, prepared for a dynamic input table: select cells C5:G390, copy the contents to the Clipboard and in SUMO, on the Inputs/Dynamics tab, click the Paste table from Clipboard button. Rename the table to “Birthday Cake” and enable repetition every 384 hours (Figure 4.7.5).
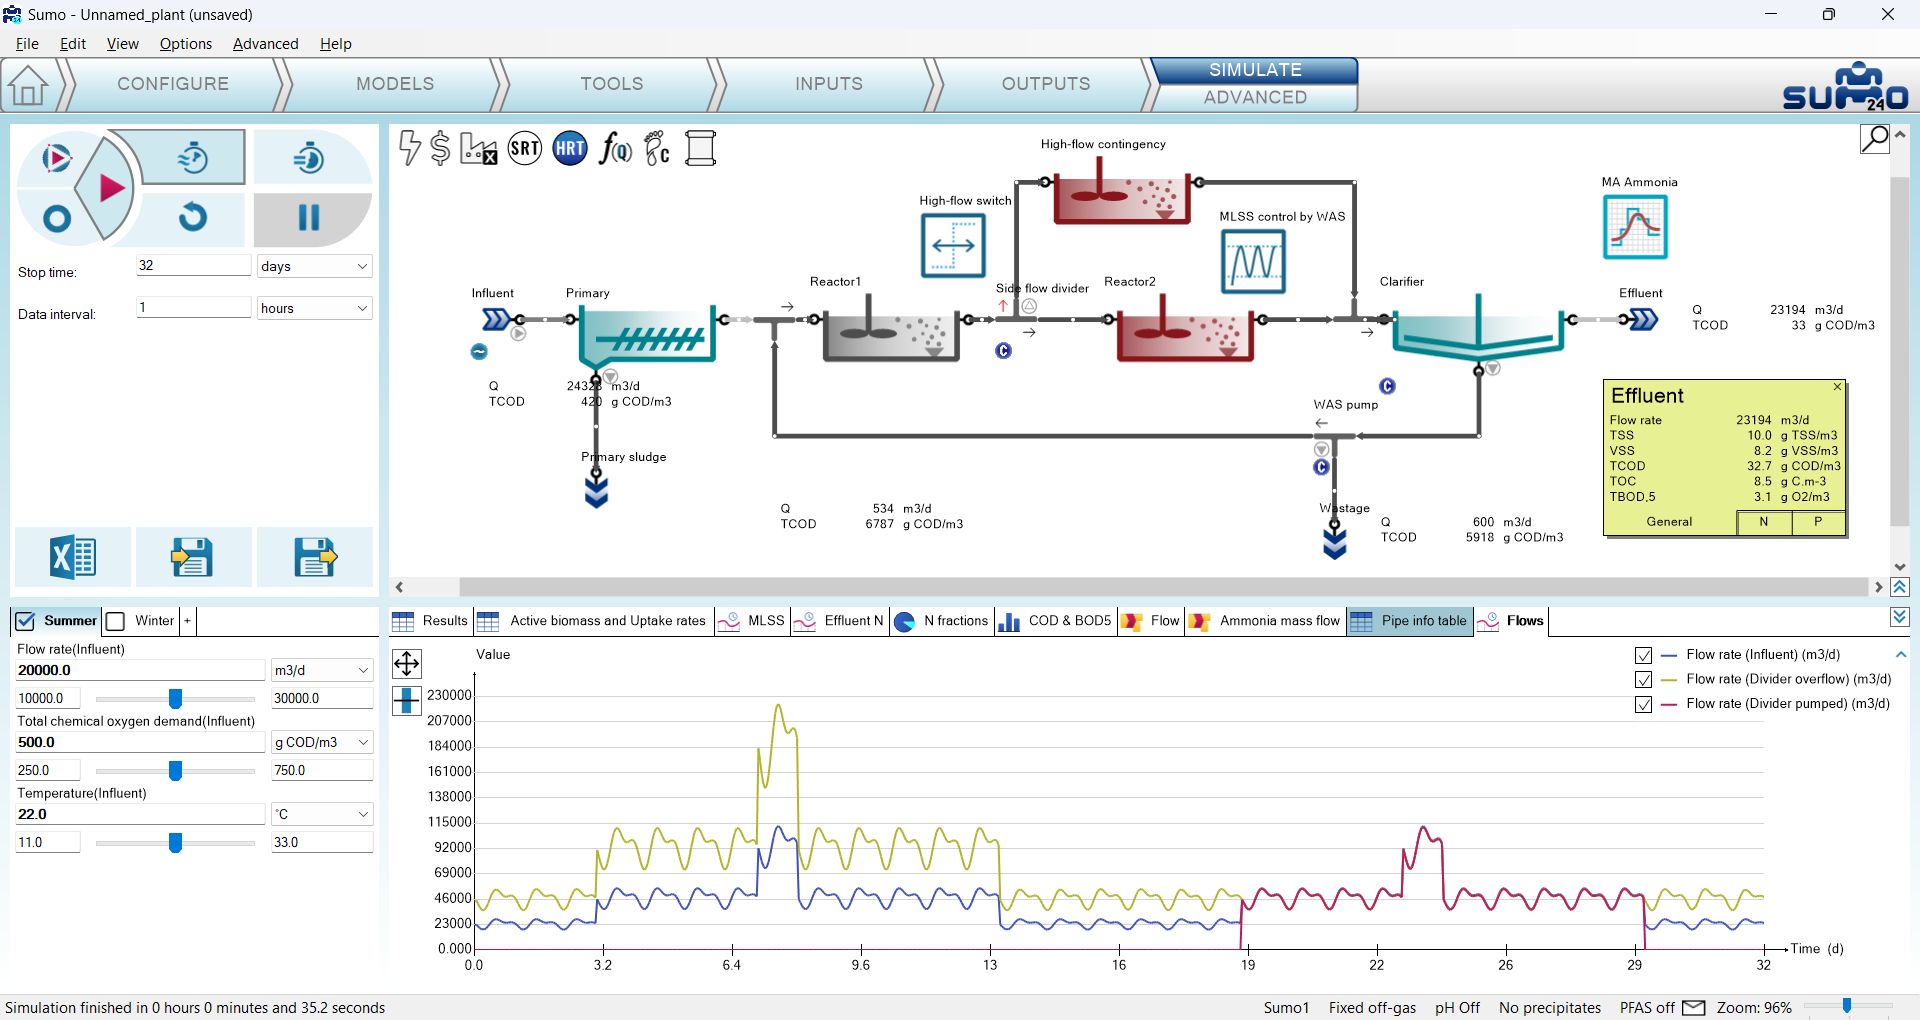
To follow the changes in the flow governance, add a timechart on the Outputs tab and rename it to “Flows”. Select the Influent and drop Flow rate from the Frequently used variables group, then select the Side flow divider and drop Flow rate from the Mass flows in overflow and Mass flows in pumped pipe menus. You may also want to rename the divider's output pipes (by selecting and right-clicking on them to reveal the flyout menu) to “Divider overflow” and “Divider pumped”, respectively, to ease their identification on the chart (Figure 4.7.6).
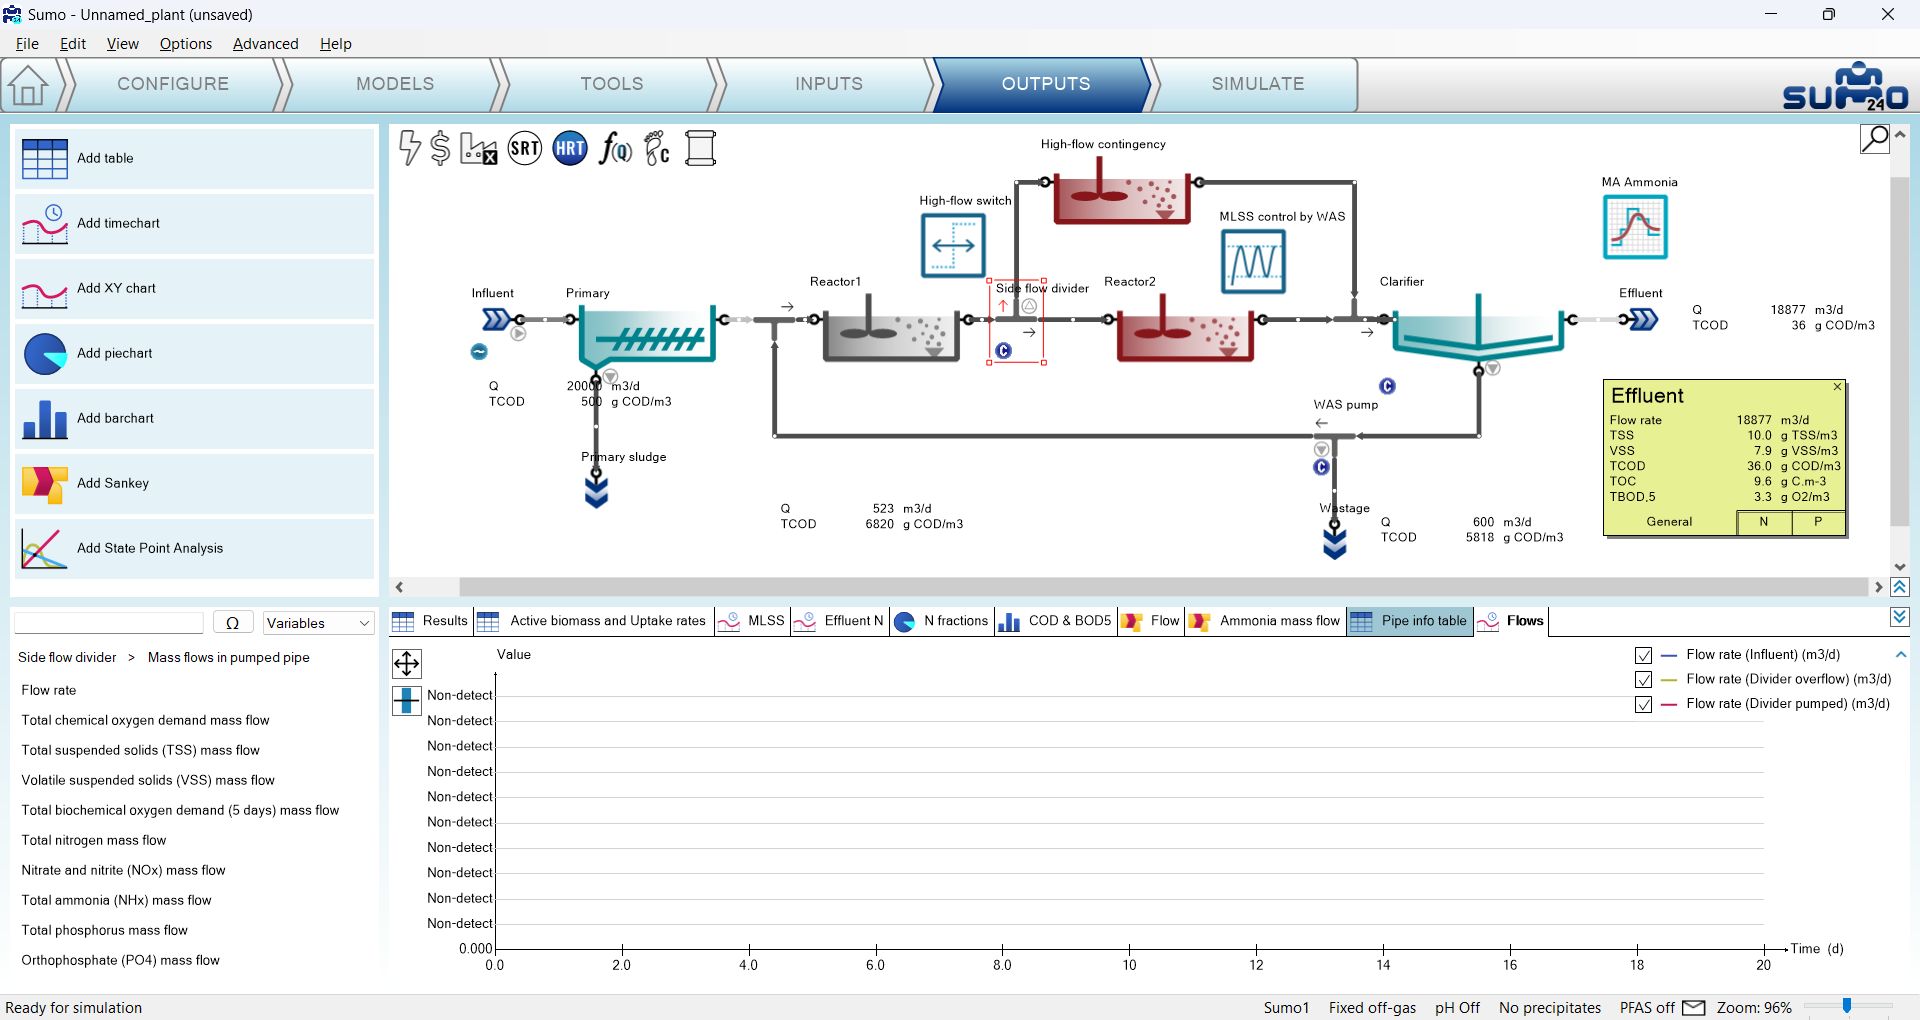
Proceed to the Simulate tab and set the stop time to 16 days. Before running the simulation, in order to demonstrate how the plant would perform without the implemented high-flow control, disable it by right-clicking on the side flow divider, and in the bottom of the flyout menu, selecting the Flow fraction to pumped manipulated by command, set it from the currently selected “High-flow switch” to None (Figure 4.7.7). The blue "C" sign underneath the divider will turn to grey, just like the icon of the High-flow switch.
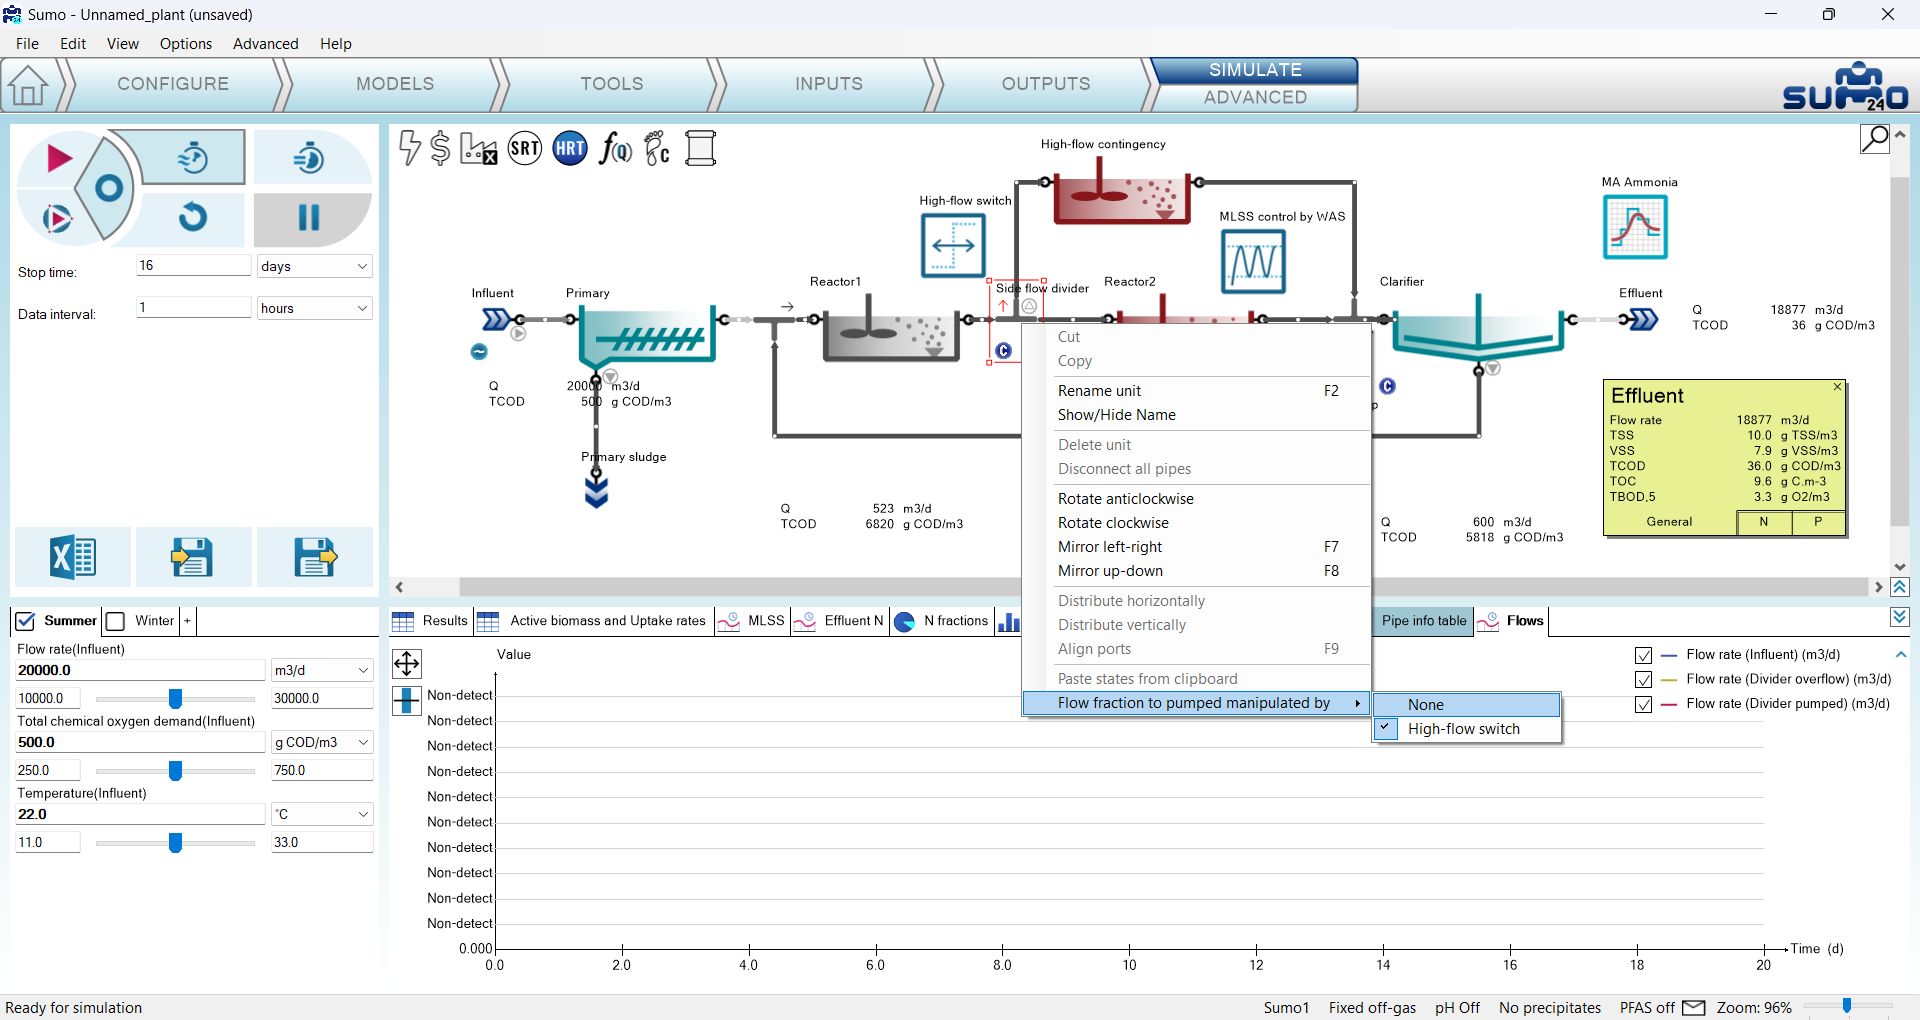
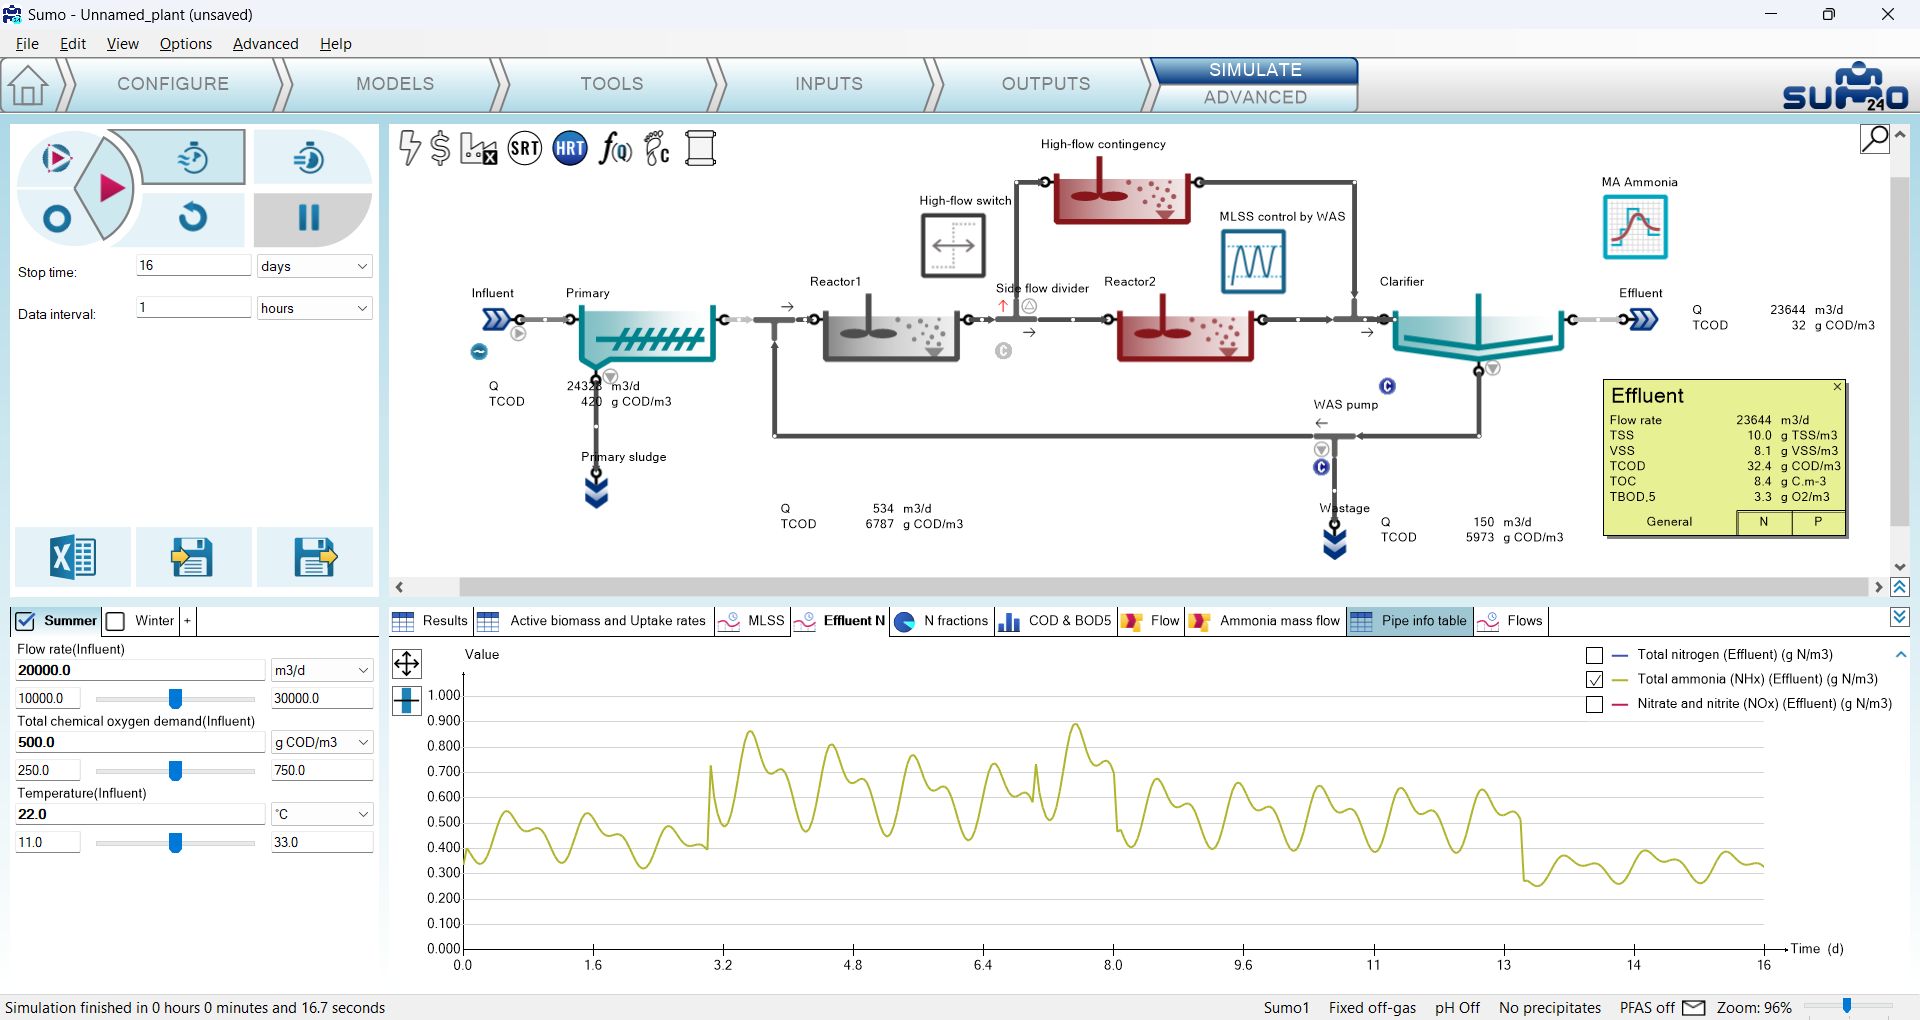
Now run the prescribed 16-day dynamic simulation. Figure 4.7.8 shows how the flow regime changes due to the pattern in the influent, while Figure 4.7.9 presents the effect on the effluent ammonia levels during this period.
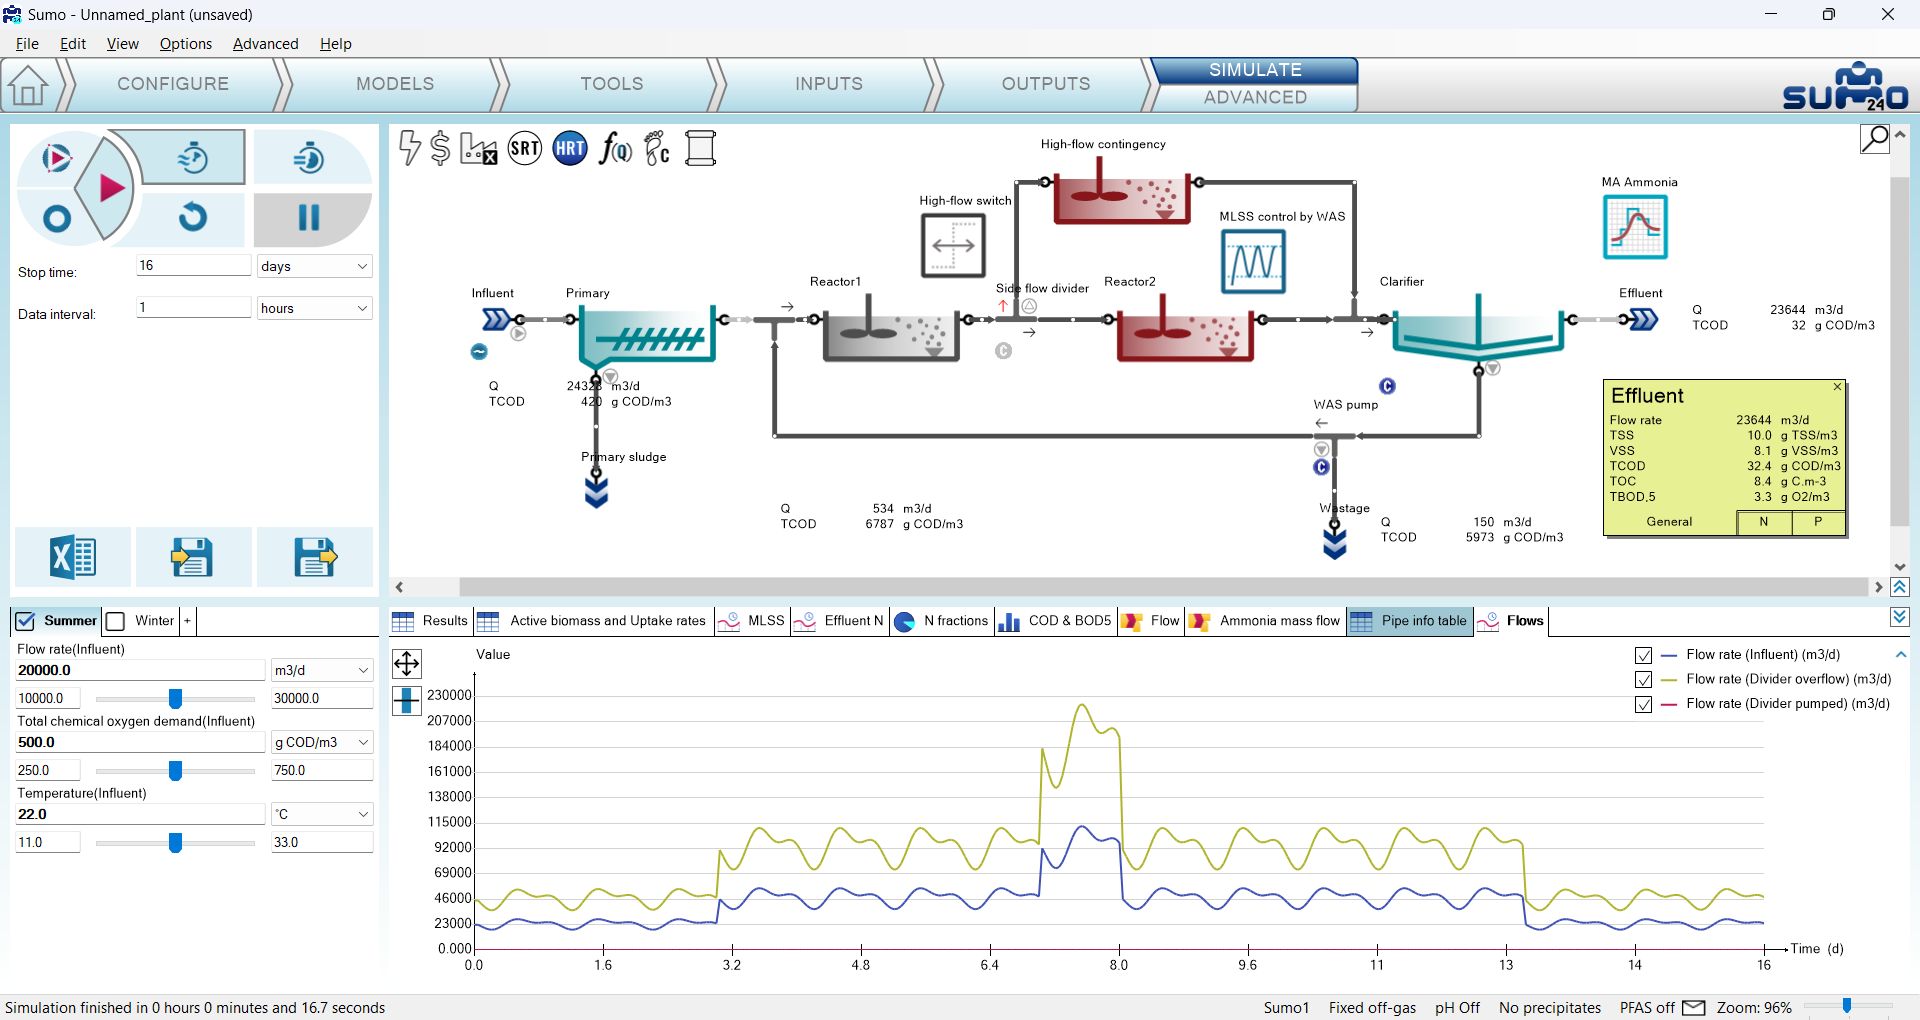
Now turn the controller back on, again by right-clicking on the side flow divider and reverting the Flow fraction to pumped manipulated by setting to “High-flow switch”. Increase the stop time of the simulation to 32 days and hit Continue. On the Flows timechart you can verify how the flow diversion gets activated when the influent flow exceeds 30000 m3/d and how it is deactivated when the influent flow falls beneath this threshold, as compared to the preceding 16-day period with no control (Figure 4.7.10).
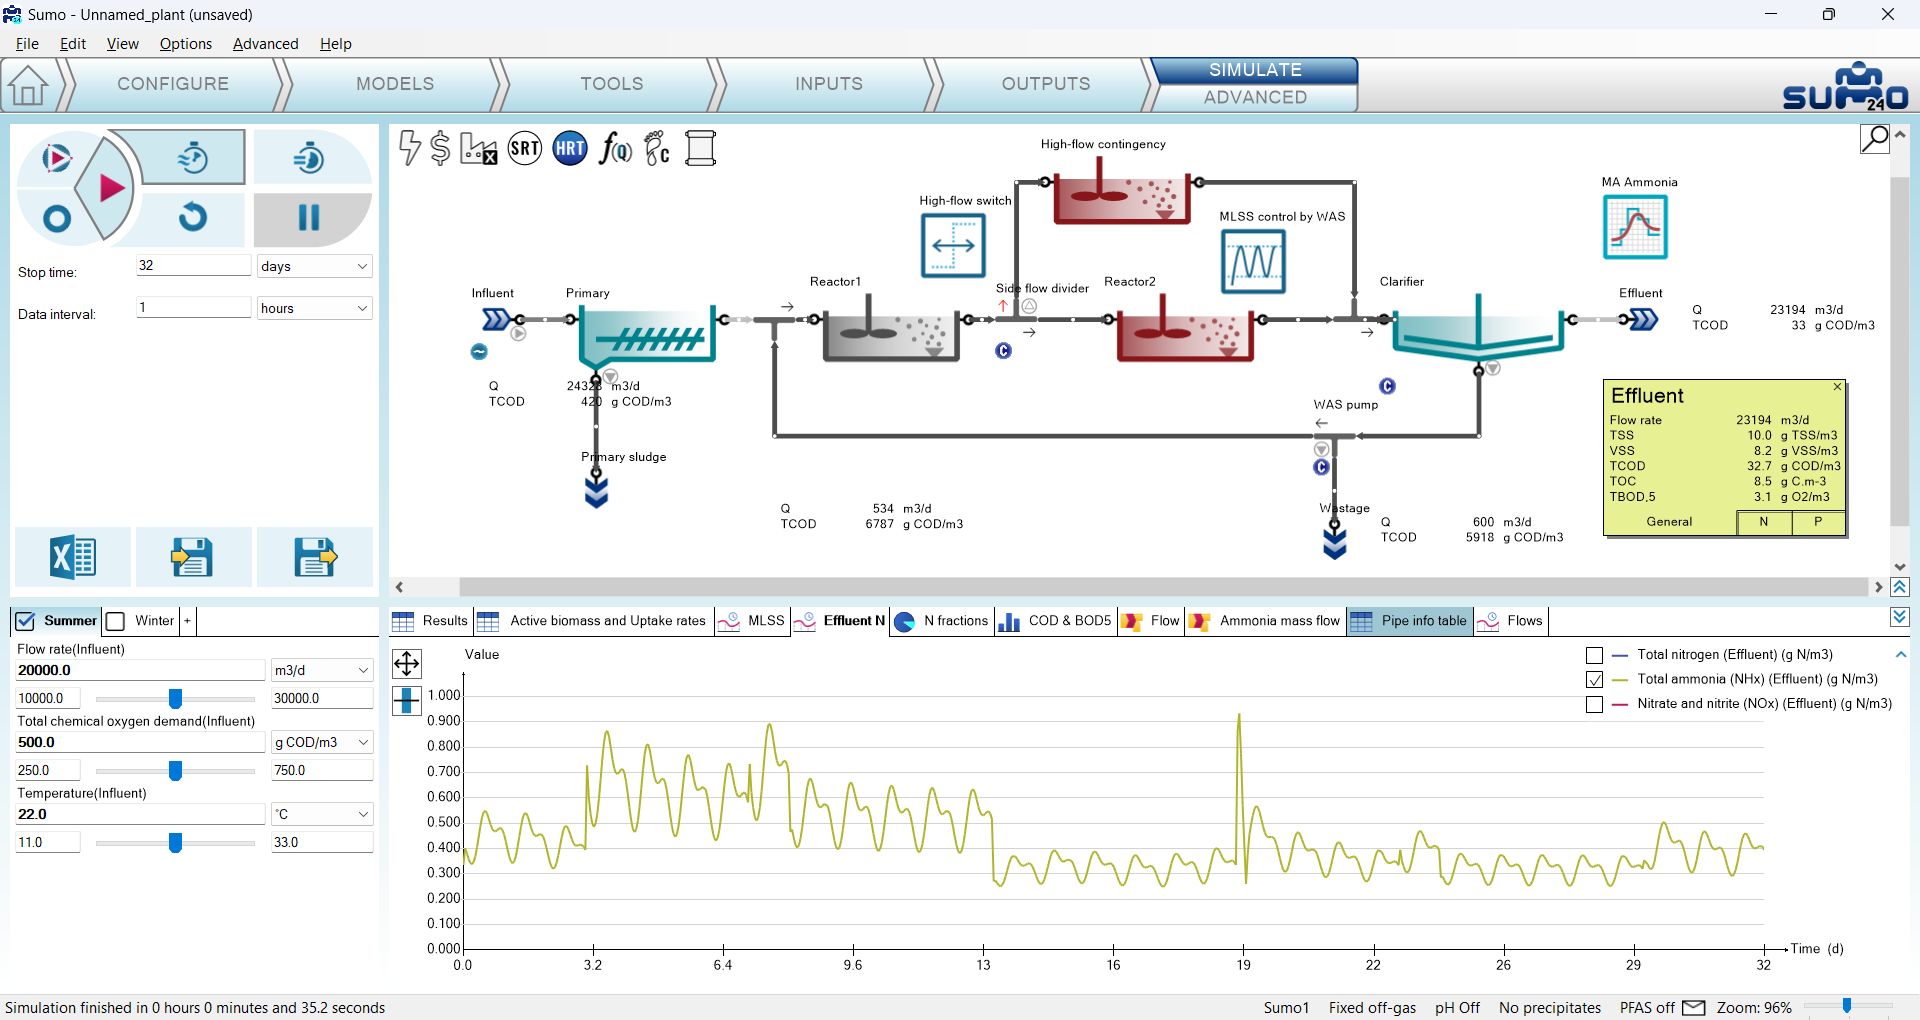
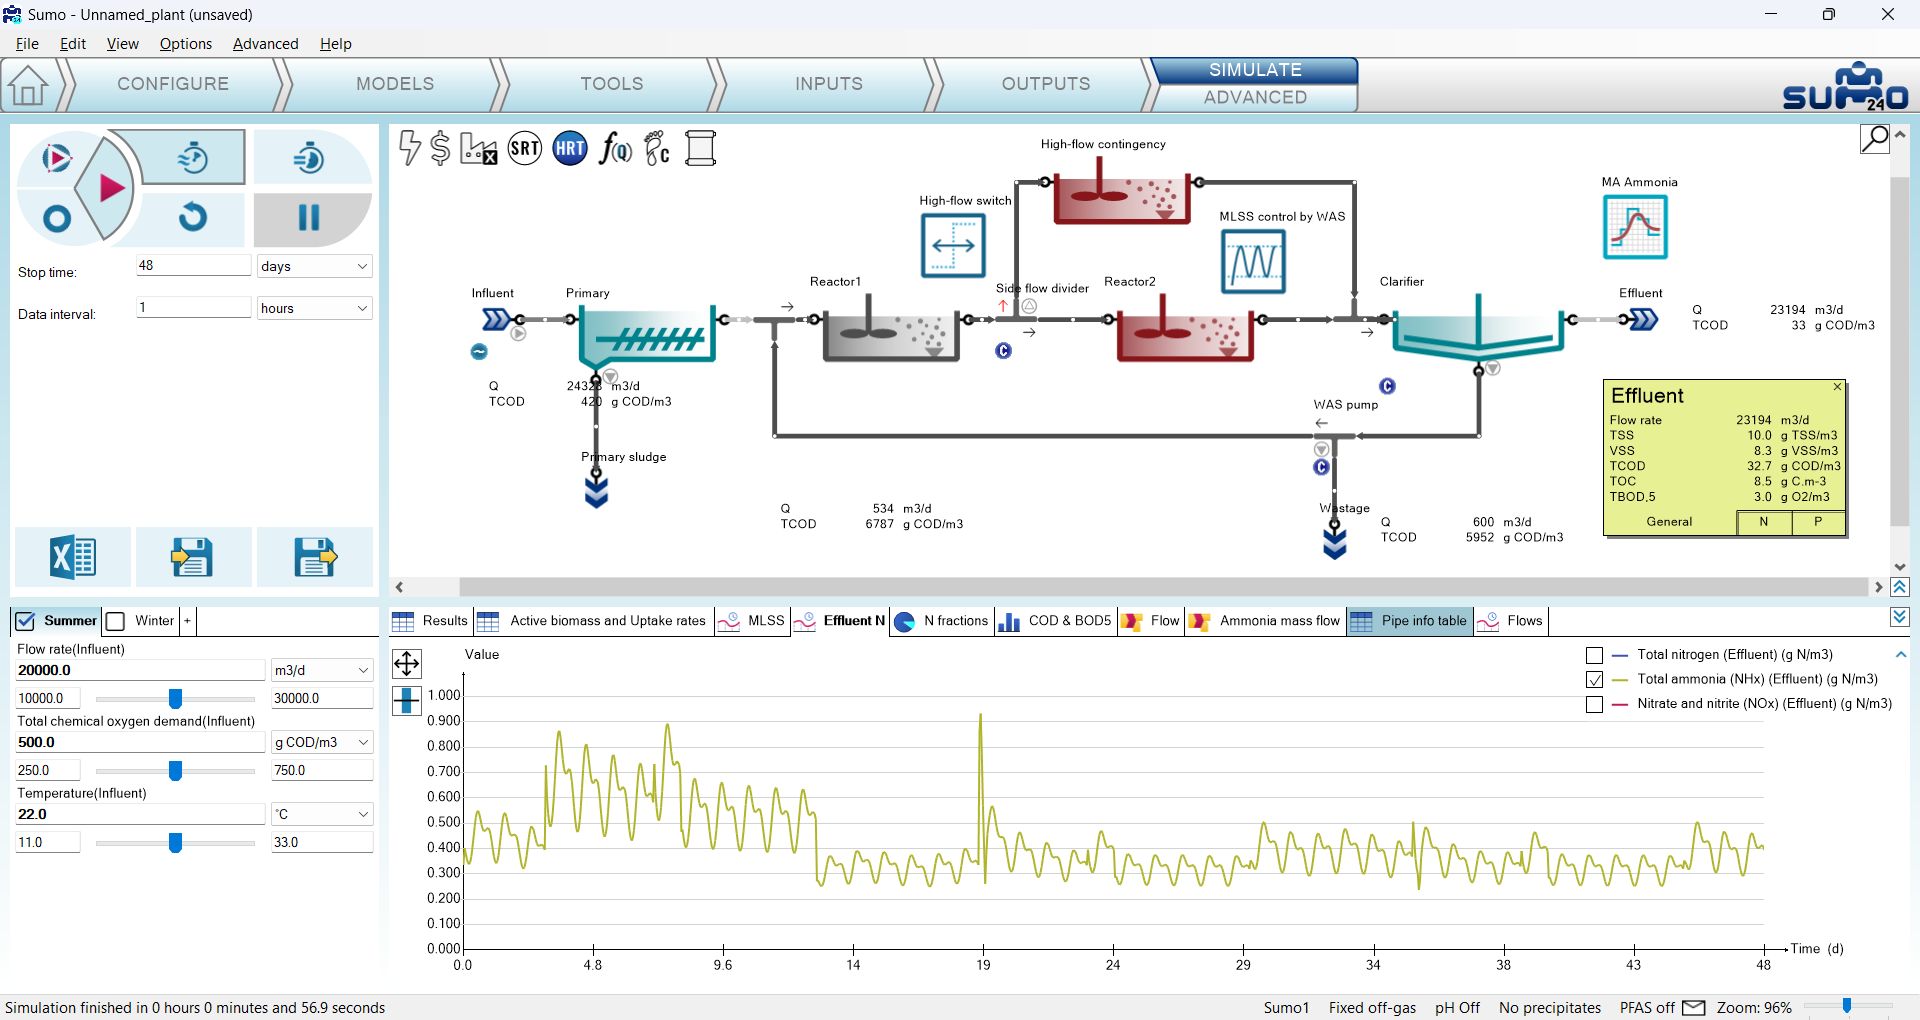
The effect of doubling the capacity of the aerated line during the high-flow period regarding the effluent ammonia levels is demonstrated by Figure 4.7.11. You can see that effluent ammonia is kept at low levels even during the high-flow period, as compared to the preceding 16-day period with no control. The only exception is when the contingency reactor is put into service the first time - this comes from a modeling boundary condition: the initial conditions of state variables in the contingency reactor are the default input values and differ greatly from what they evolve to when it becomes a functioning part of this specific layout. If you extend the stop time to 48 hours and hit Continue, you will see that the next time the contingency reactor comes online, the transition will be smoother (Figure 4.7.12).
¶ Cascade controller
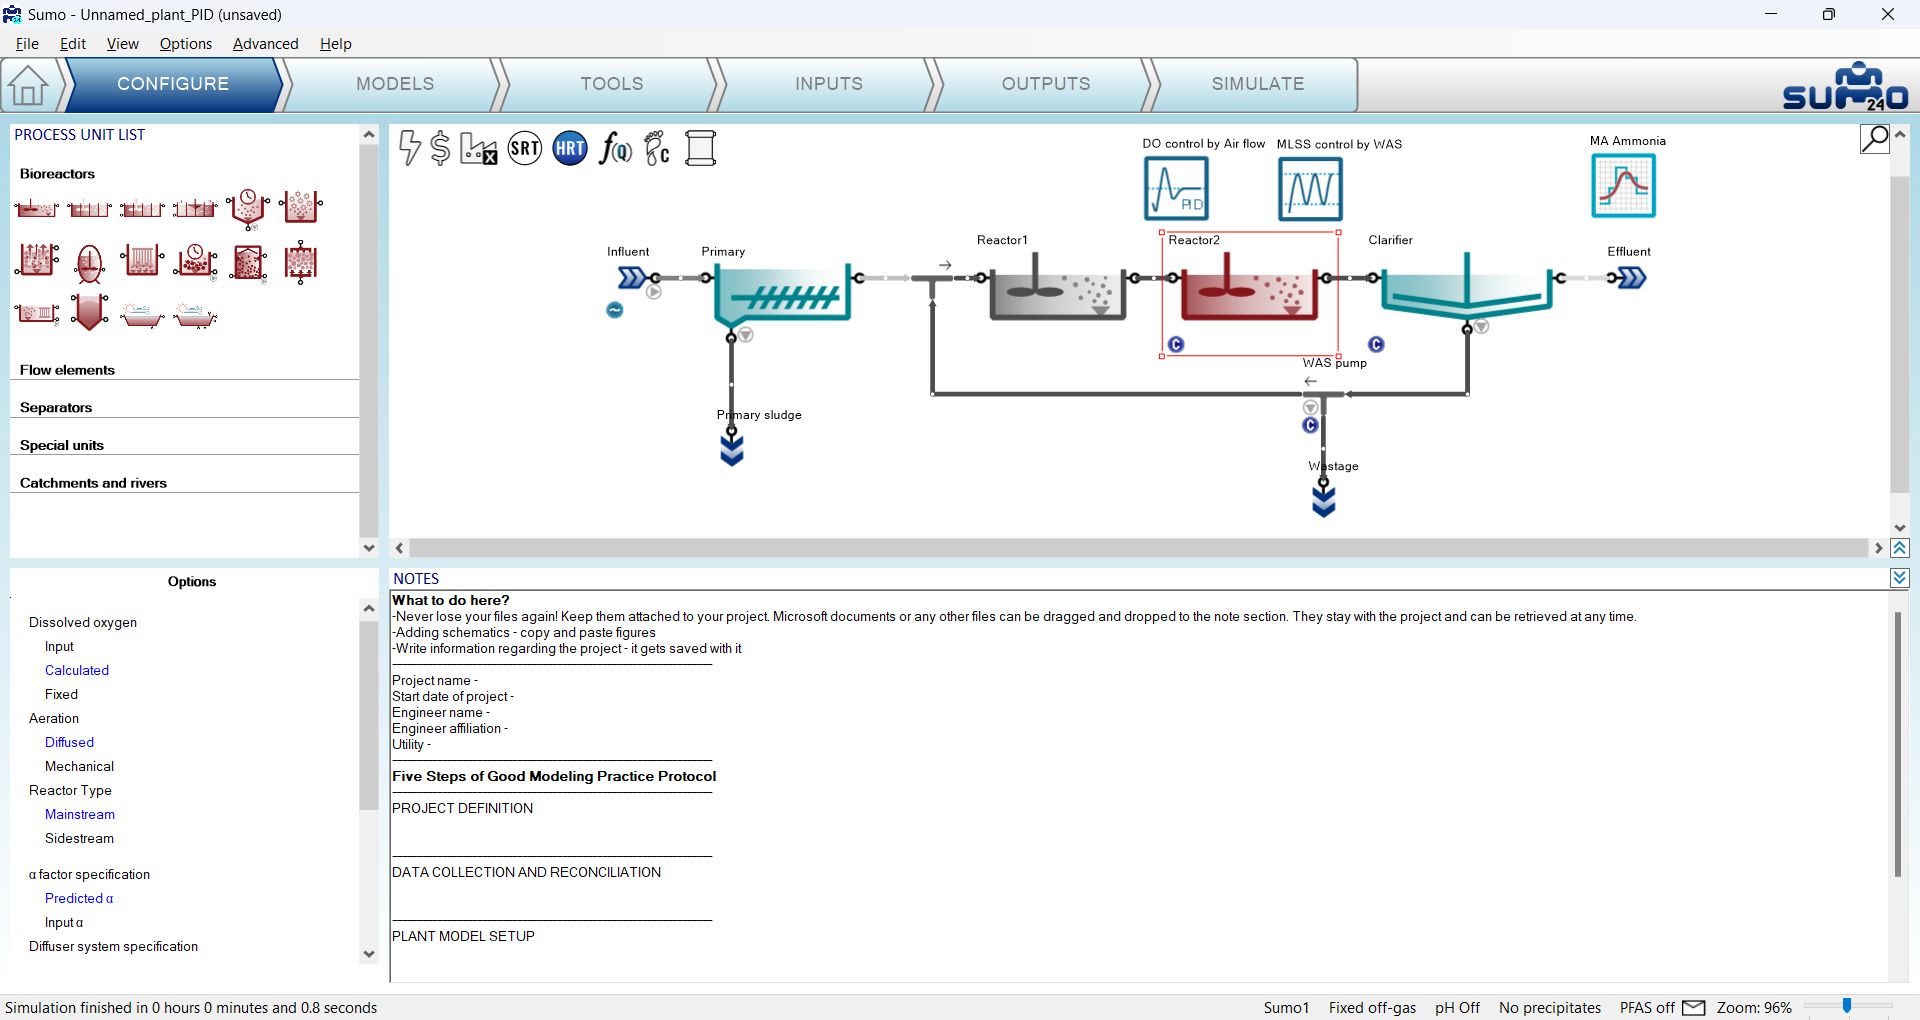
Cascade controllers can as well be set up in SUMO, using the methods described above. To set up a cascade controller example, a PID and a Time-based on-off controller will be used in conjunction. Based on the time-based controller example it can be easily shown how the DO calculation effects the process in the reactors. To see the effect of calculated DO, the example prepared with the PID controller will be continued. In that example, the DO is calculated in Reactor 2 (Figure 4.8.1).
Go to the Tools tab and add a Time based on-off controller. In this example, we will generate a high-low setpoint, time-based aeration, by changing the DO setpoint, which is controller setpoint of the PID controller. To set up the Time based on-off controller, drag and drop the DO Control by Air flow controller icon from the drawing board to the left side of the equation in the bottom right panel and select Controlled variable setpoint from the Controller parameters menu in the bottom left panel. Rename the unit (using F2 or right click) – along with the tab – to “High-low setpoint aeration” (Figure 4.8.2).
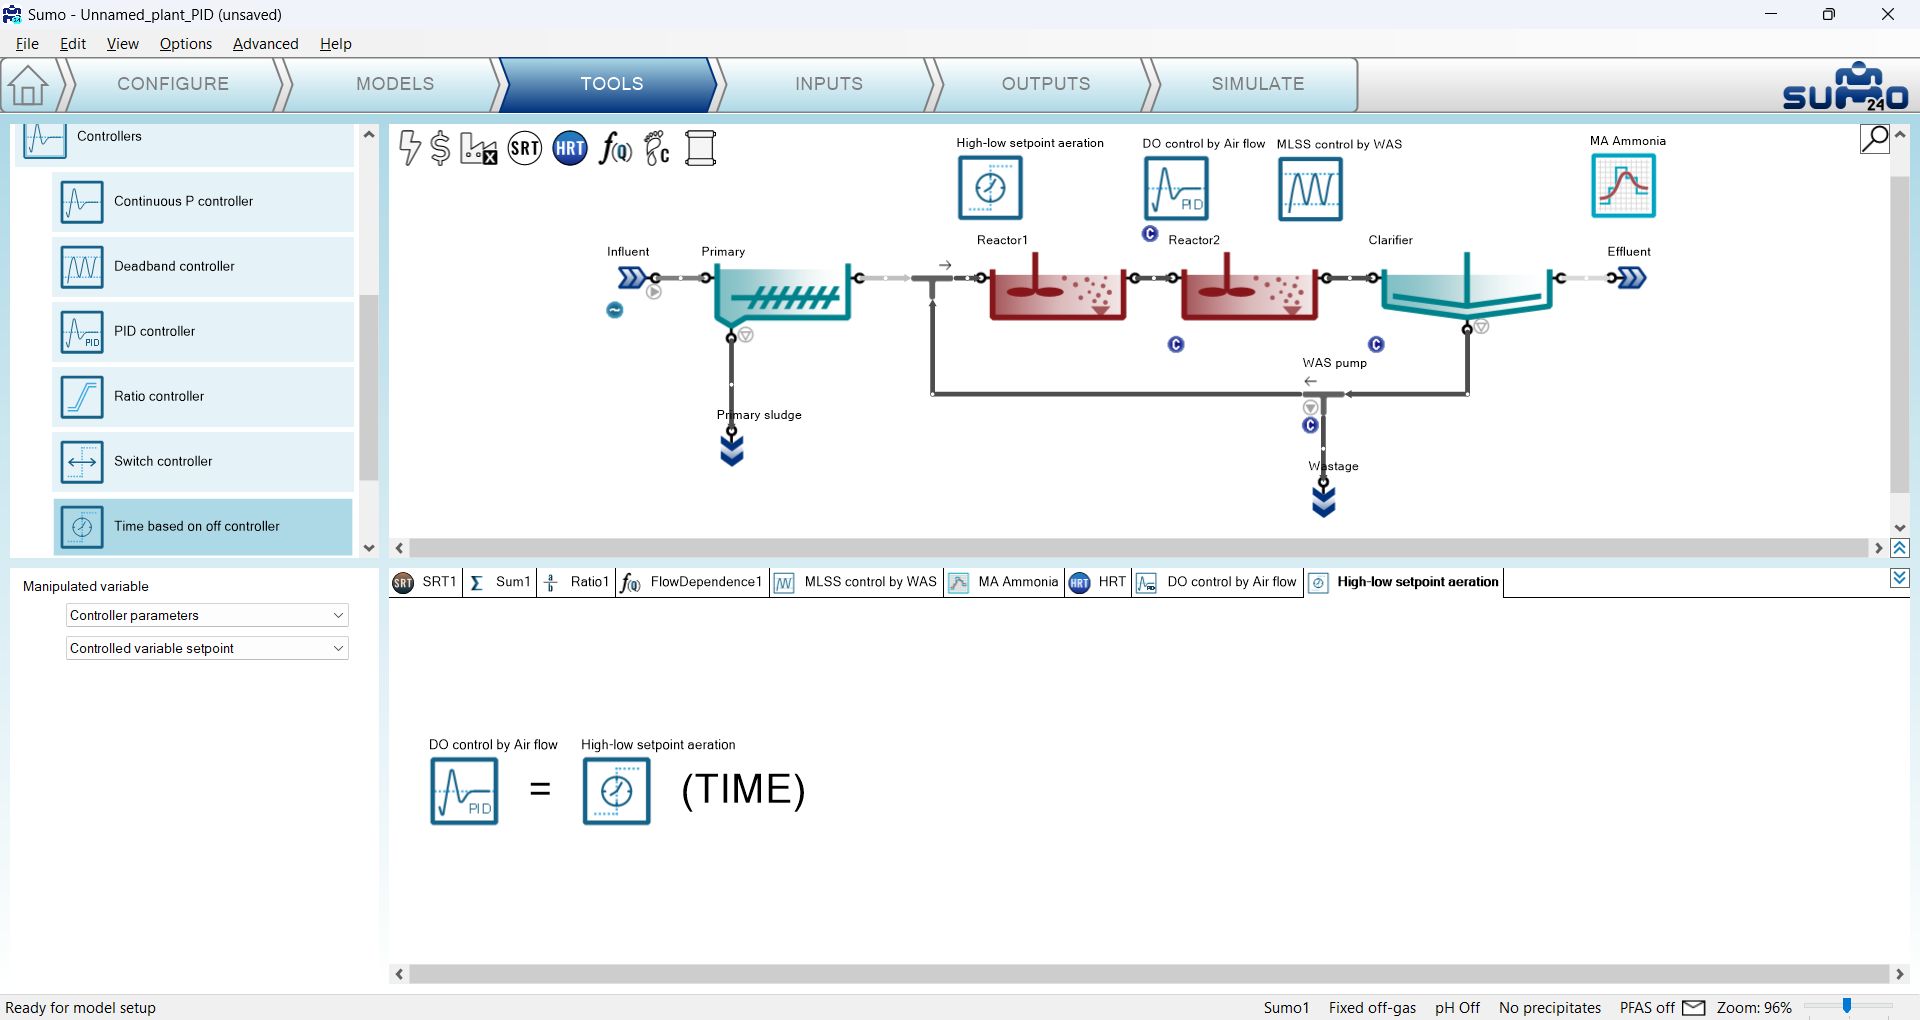
On the Inputs tab, select the new High-low setpoint aeration controller and in the Time based on-off controller parameters menu set the following (Figure 4.8.3):
- the Cycle length to 2 h (this is the default value),
- the Duration while the manipulated variable is set to high to 1 h (higher setpoint will be in effect for 1 h),
- Low value of the manipulated variable to 50% (or 0.5 without unit, depending on the Unit system settings), this equals 0.5 g O2/m3 as dissolved oxygen setpoint, and leave the other parameters as default.
Now select the DO control by Airflow controller and in the Controller parameters menu, set the Controller time step to 1 min (Figure 4.8.3).

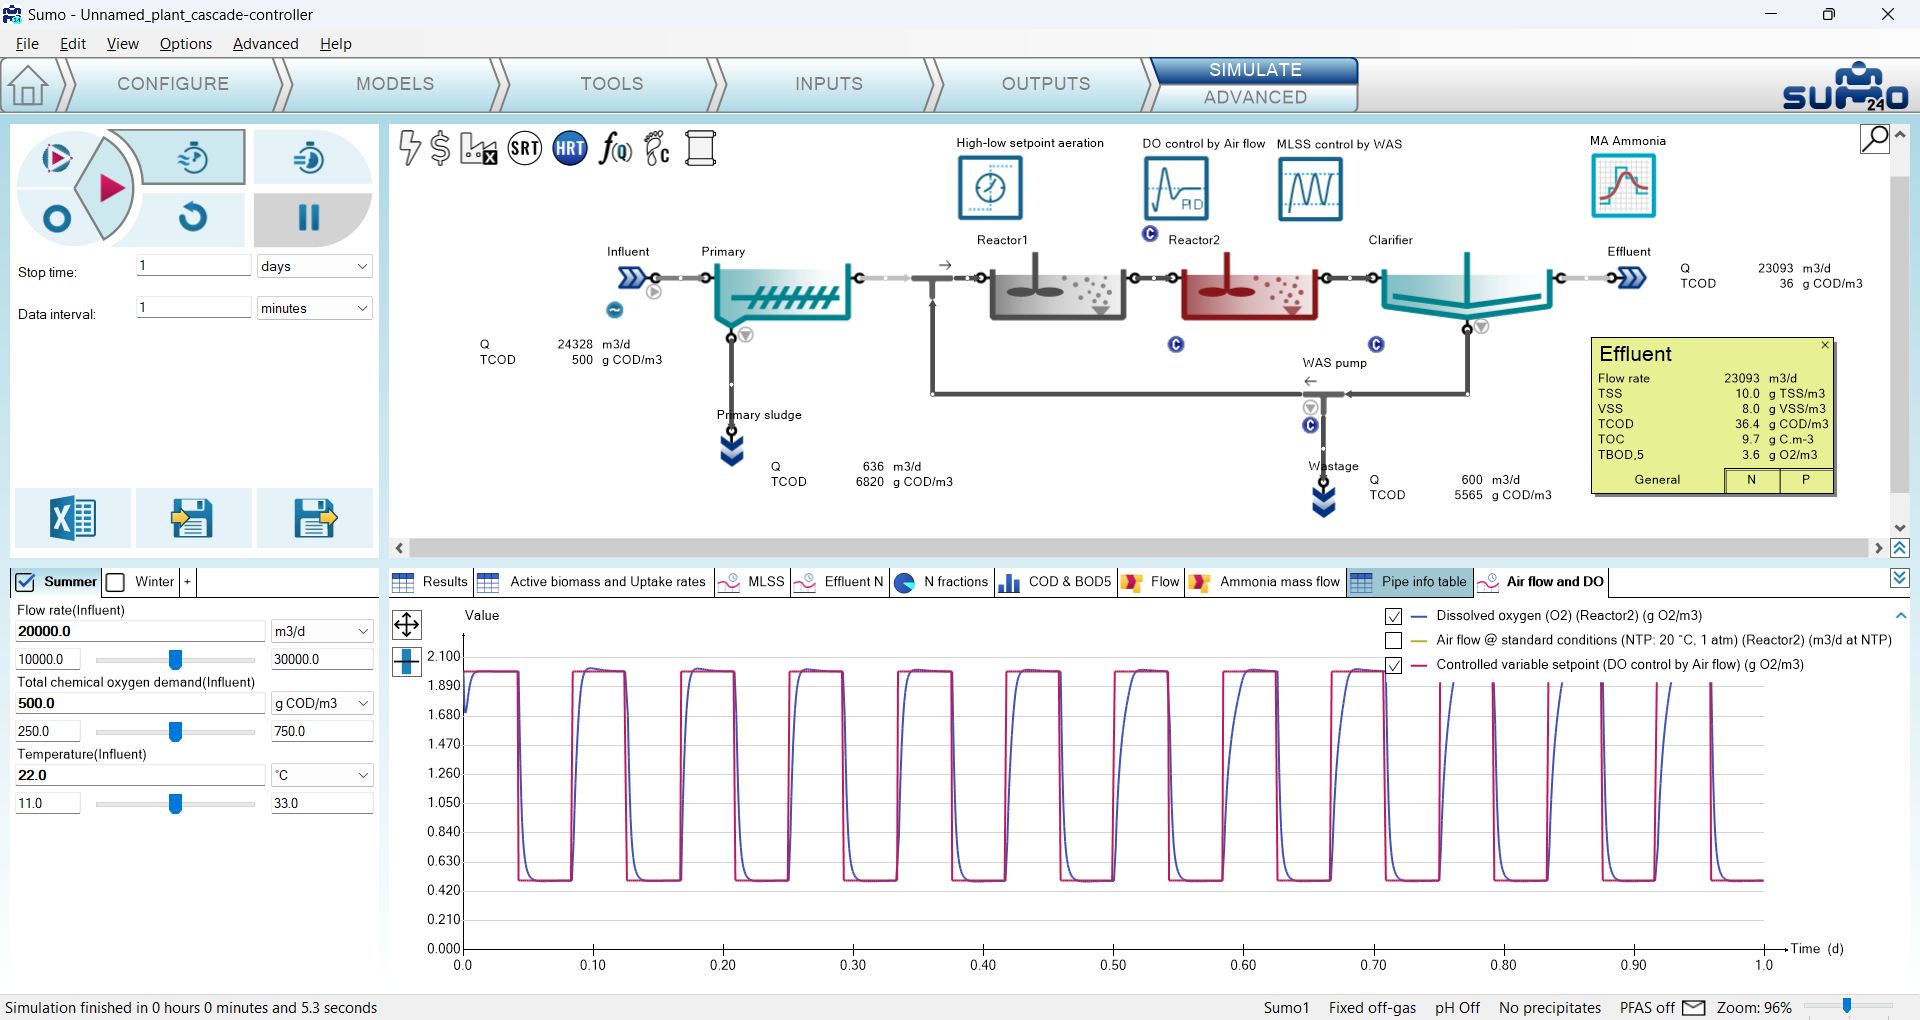
Go to the Simulate tab, set the stop time to 1 d and the data interval to 1 minute and start a dynamic simulation. Select the “Air flow and DO” timechart. The change of DO follows the aeration change controlled by the PID controller (Figure 4.8.4). Compare the new results with the results of the simple Time based on-off controller exercise on Figure 4.6.4.
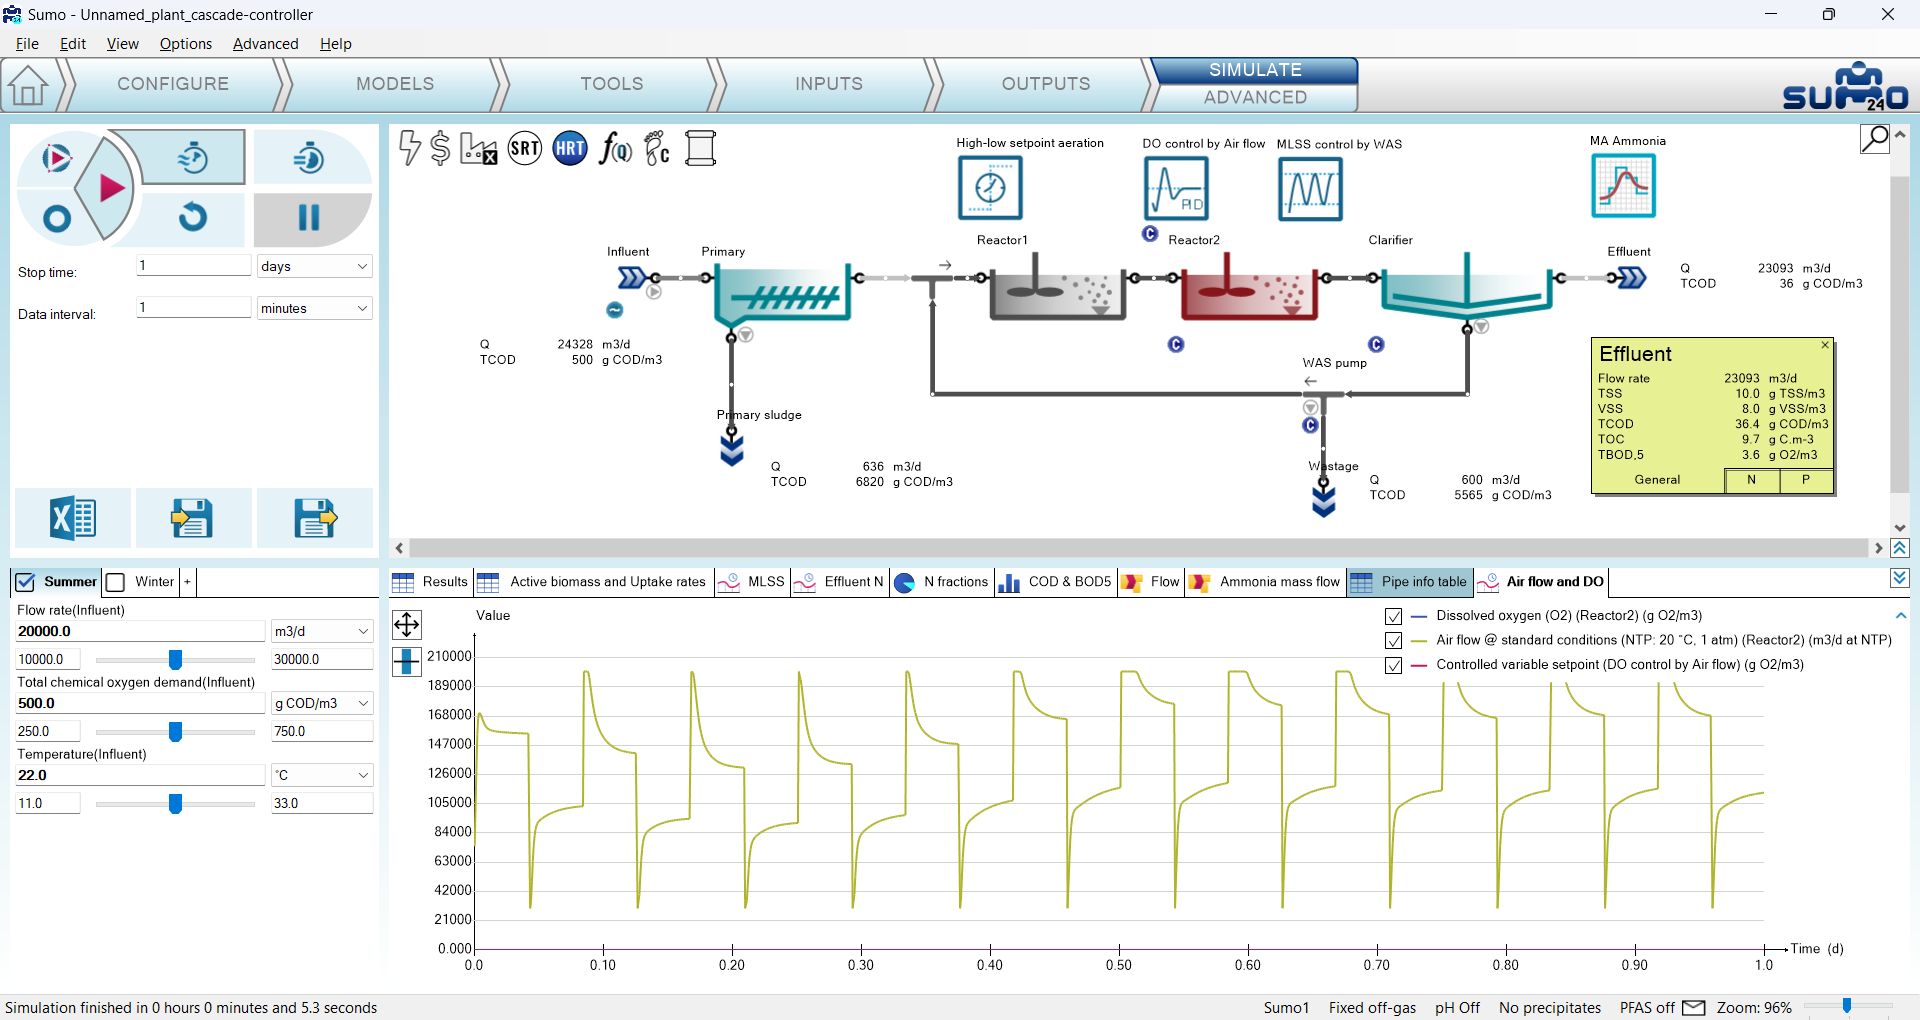
The change of Input air flow (Figure 4.8.5) shows a really different profile compared with the simple Time based on-off controller exercise (Figure 4.6.3).
¶ Statistical units
¶ Introduction to statistical units
Statistical units are used to calculate outputs based on model variables. For example, the moving average of effluent ammonia can be calculated, or mass flows can be totalized into mass pumped over the simulation period or a dedicated cycle.
There are a few different type of statistical units implemented in Sumo, which can be accessed from the Tools tab (Figure 4.9.1):
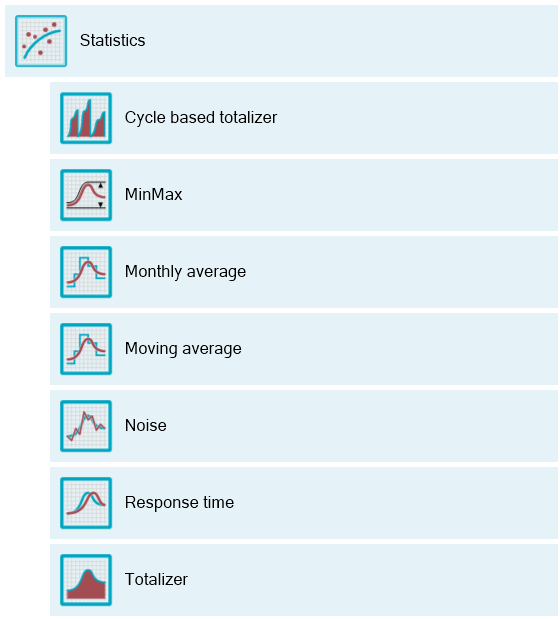
Clicking the Statistics button on the Tools tab will open this dropdown list of units, where you can pick the desired one and configure the calculation.
¶ Cycle based totalizer
The Cycle based totalizer integrates a variable over time, typically applied on mass flows over a specific time window.
¶ Min/Max
The Min/Max unit stores the minimum and maximum values of a variable over the simulation period
¶ Monthly average
The monthly average is a special unit that grabs values of a variable at a given frequency, and generates the monthly average values based on the Month indicator. Using the Bardenpho example from the Nutrient removal examples (Home page, bottom right panel) the effluent ammonia concentration will be used as an example.
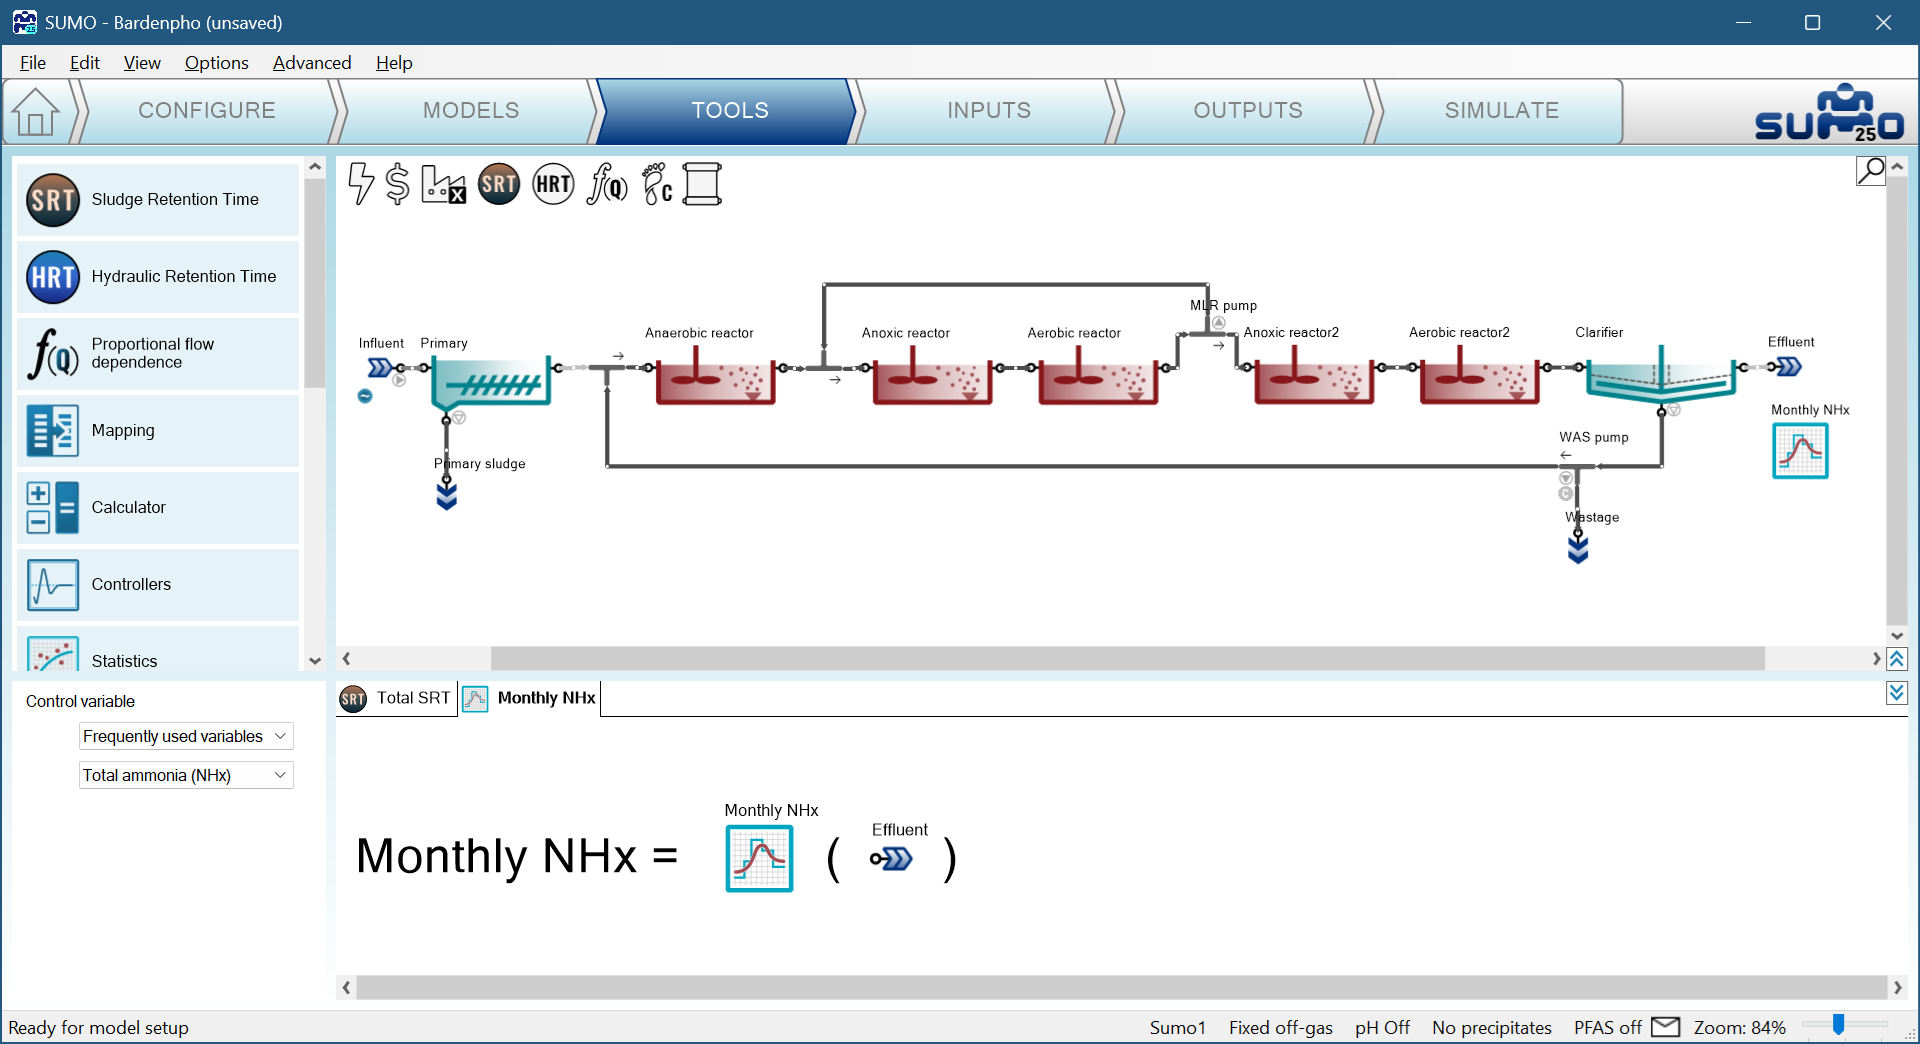
The first step is to add a Monthly average statistics unit to the layout, drop the Effluent unit on the right hand side of the equation and rename the Tab header to "Monthly NHx" to calculate the monthly average effluent ammonia concentration from grab samples (Figure 4.9.2).
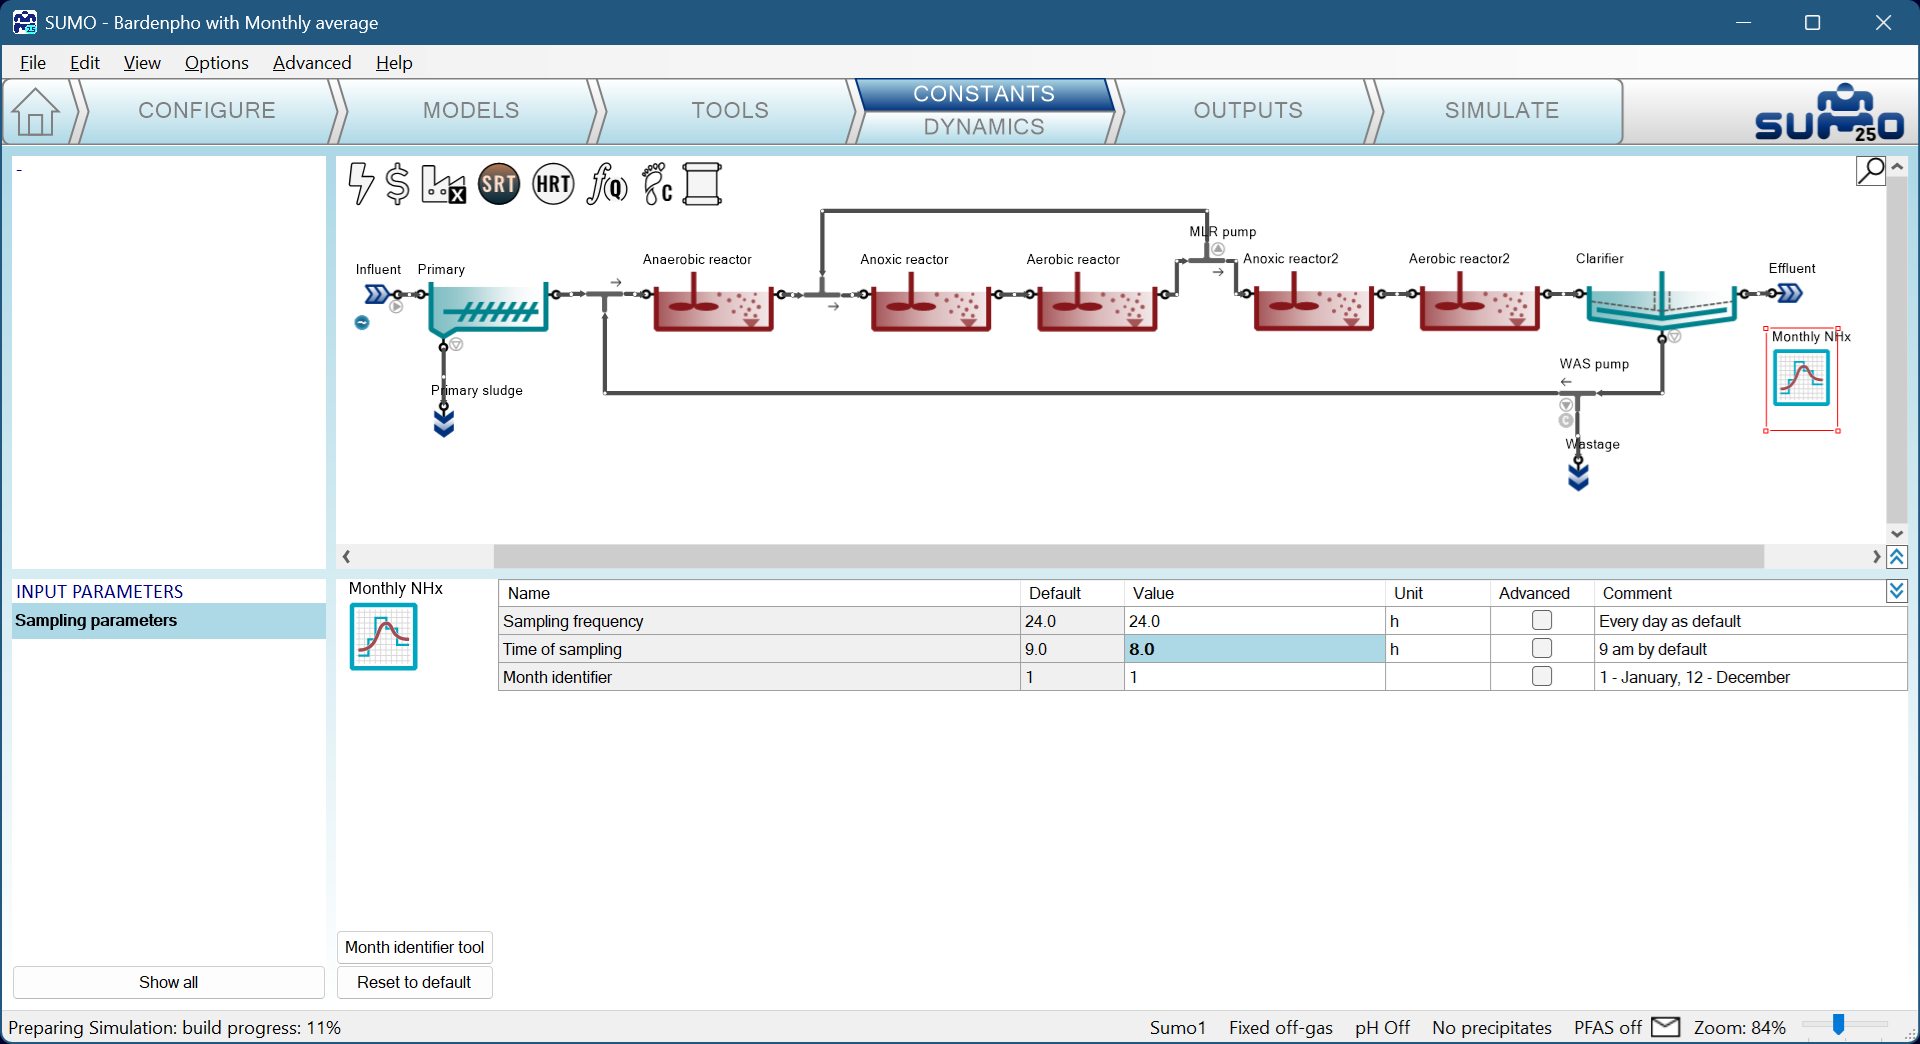
The next step is to configure the calculation at the input setup for grab samples at 8 am, every morning - considering already that the simulation will be started at midnight. For comfort, change the default units from day (d) to hour (h) in input the setup (Figure 4.9.3).
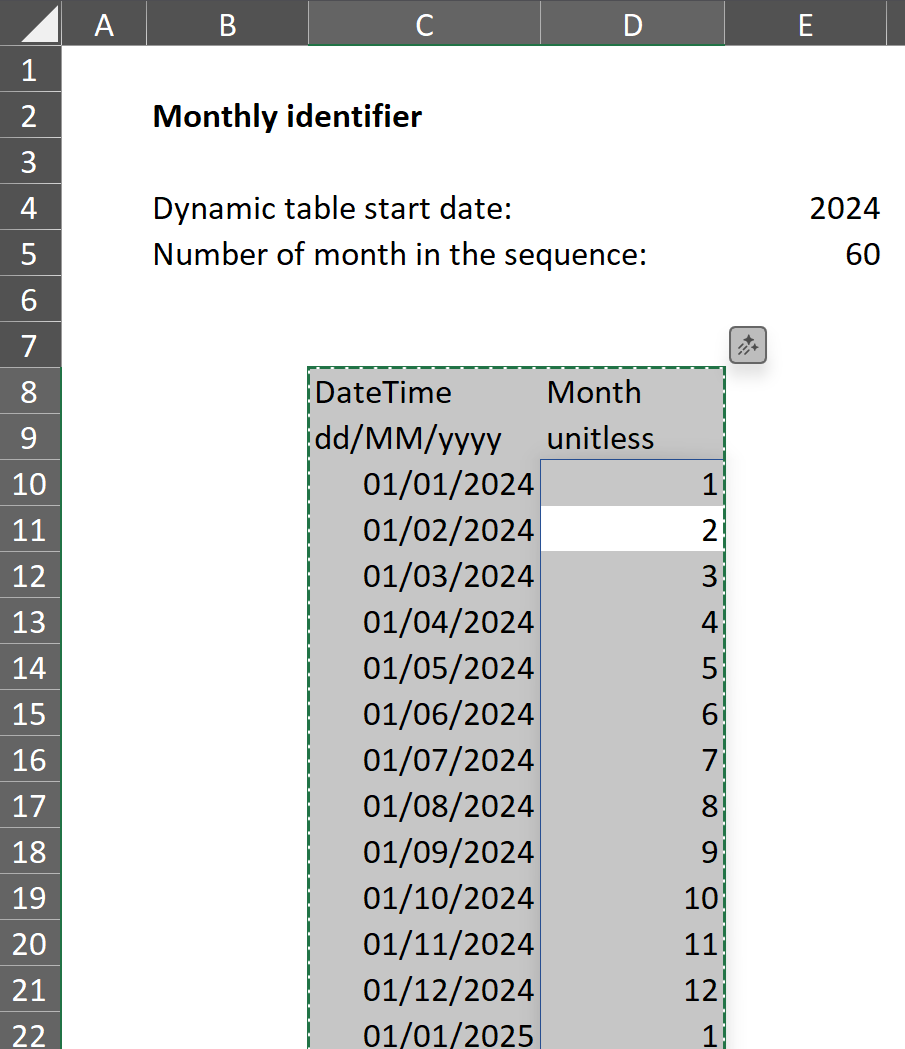
The key to the setup is to define when the change of month takes place. To achieve this, a small workaround is introduced: set up a date-based dynamic input for the Month identifier parameter, using the Month identifier tool. Click the button to open a prepared spreadsheet and copy the default table (Figure 4.9.4), then paste it as a dynamic input table for the “Monthly NHx” unit (Figure 4.9.5). Pay attention that the format defined in the DateTime column matches the date format used below it (non-English language locale may affect the format that appears in the spreadsheet - in such cases please redefine the format manually before copy-pasting to SUMO).
 |
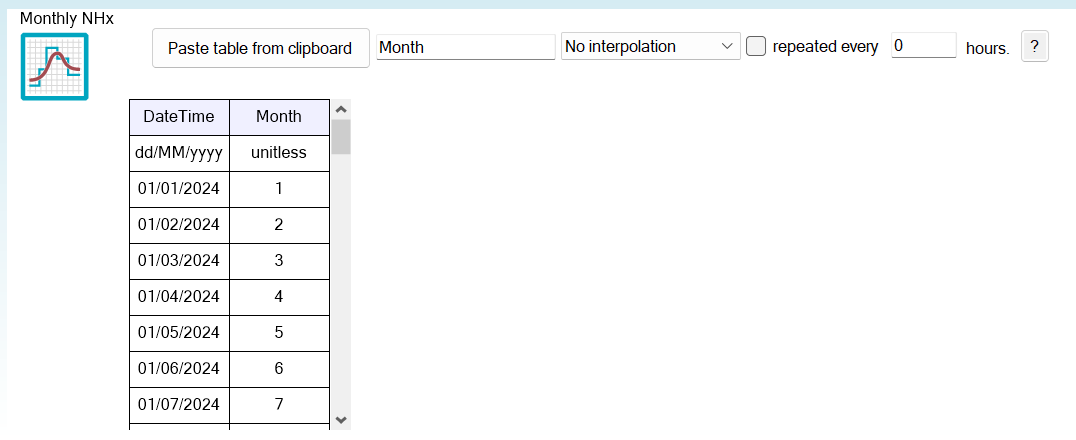 |
| 4.9.4 - Date-based table | 4.9.5 - Inserted in SUMO |
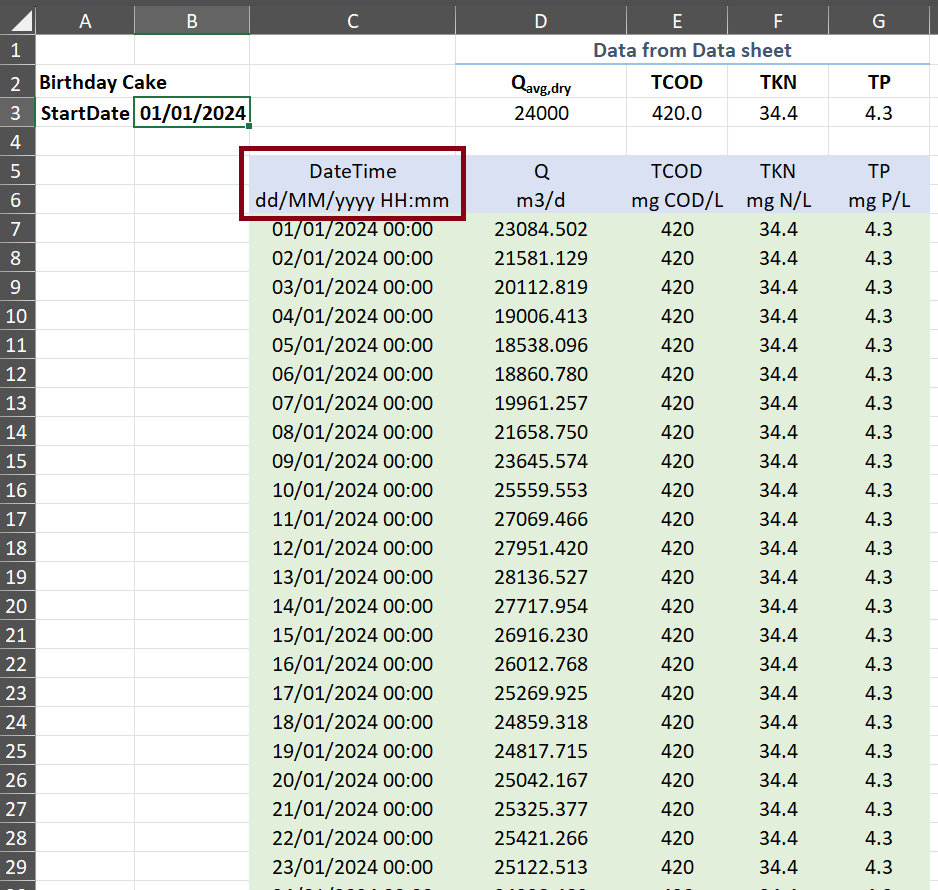
A similar exercise shall be executed for the Influent parameters. Taking the Birthday cake sheet of the Influent tool as a base, convert it to use DateTime as it is depicted on Figure 4.9.6 (for details regarding the date and time based dynamic input see chapter 3). Please note that the original hourly-paced data table will now have daily entries with the same data.
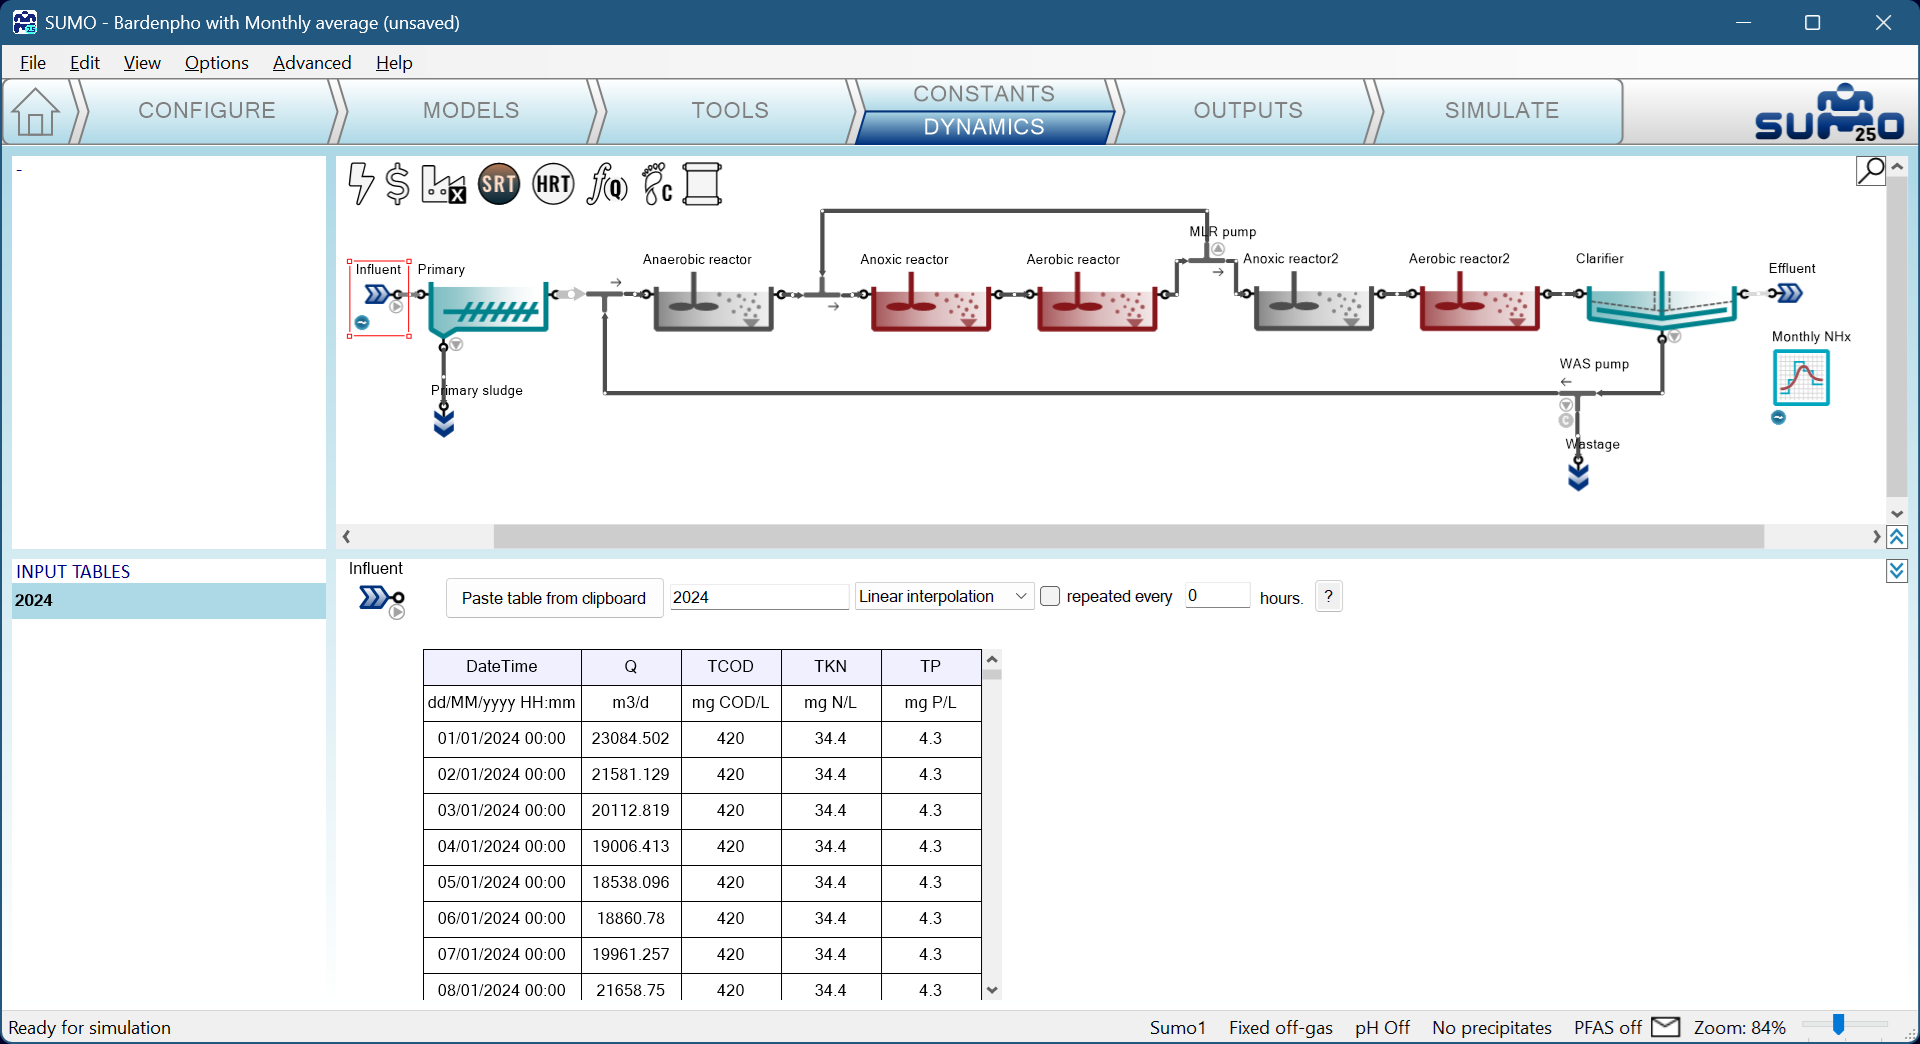
Next, copy and paste this modified, date and time based table as dynamic input for the Influent (Figure 4.9.7). Select Linear interpolation to make the data smoother.
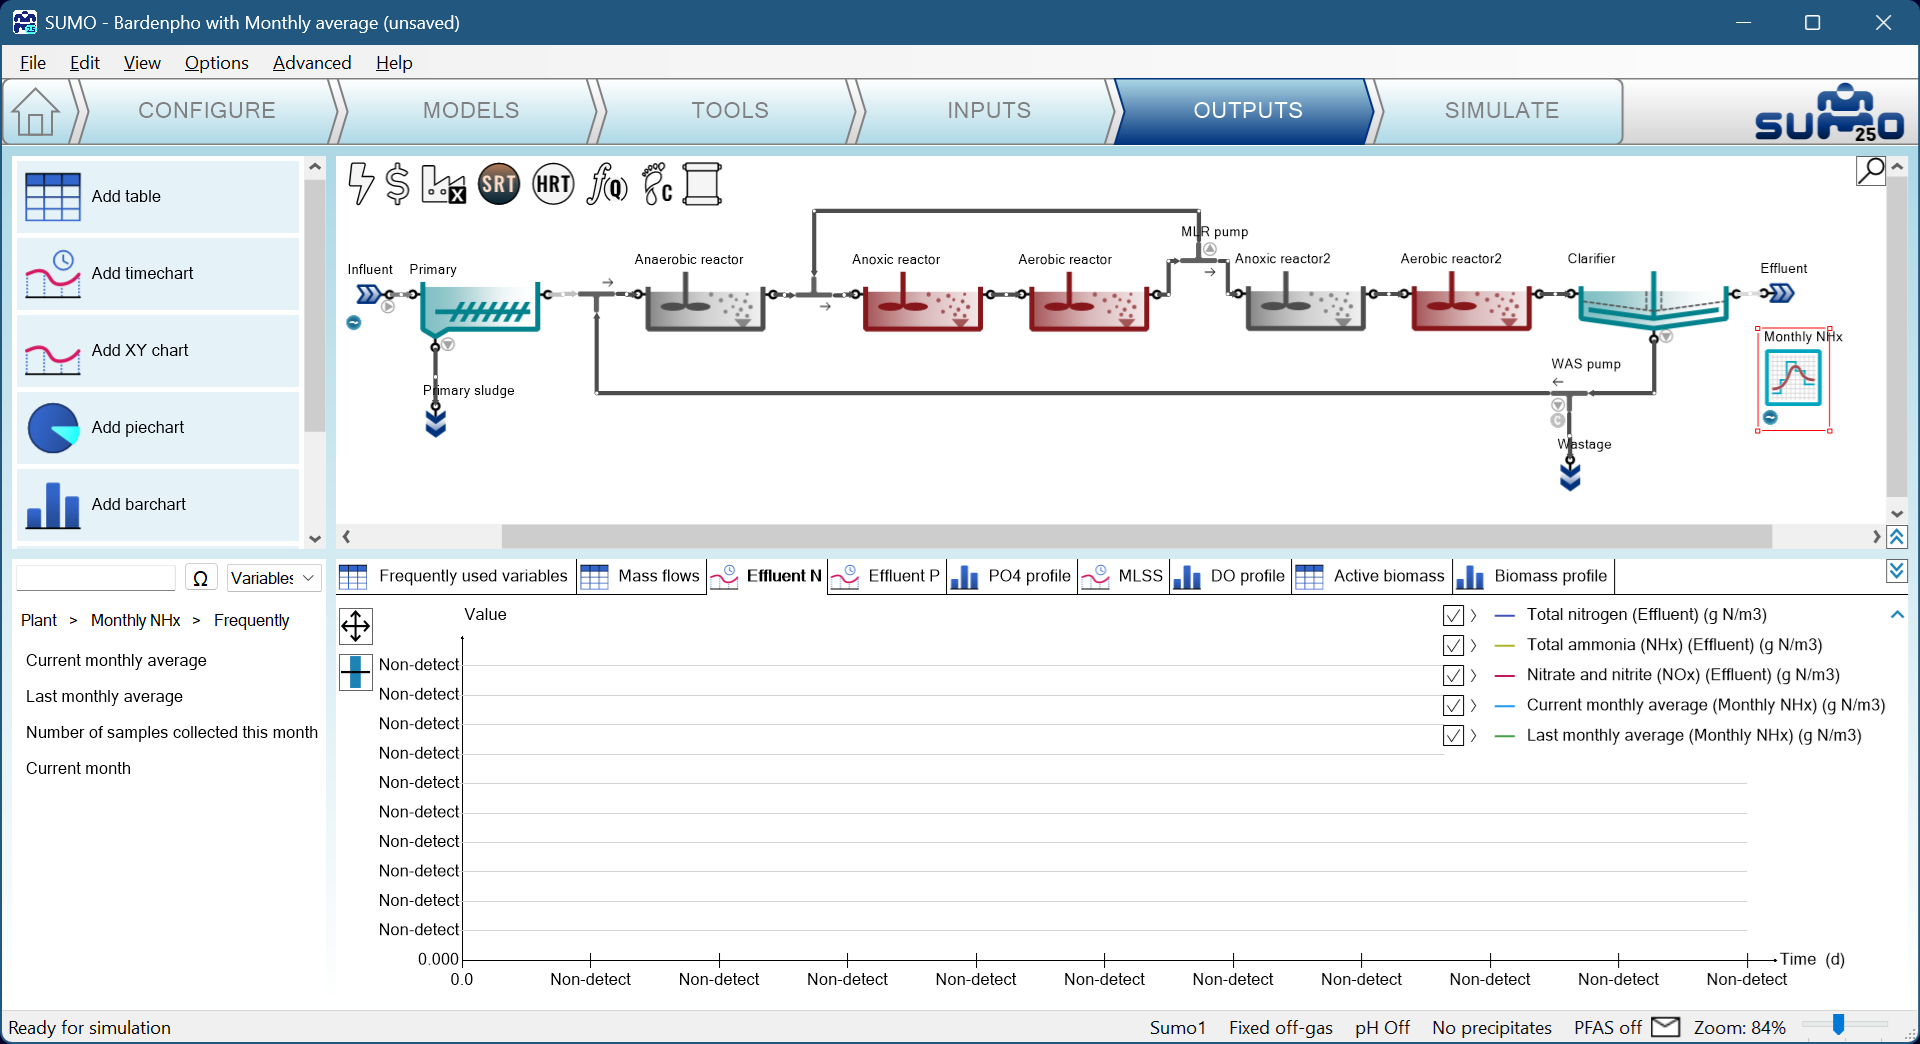
The last step before the simulation is to set up the Outputs. The predefined Effluent N timechart can be extended with the current and last monthly average variables by selecting the “Monthly NHx” unit on the drawing board and browsing from the Frequently used variables (Figure 4.9.8):
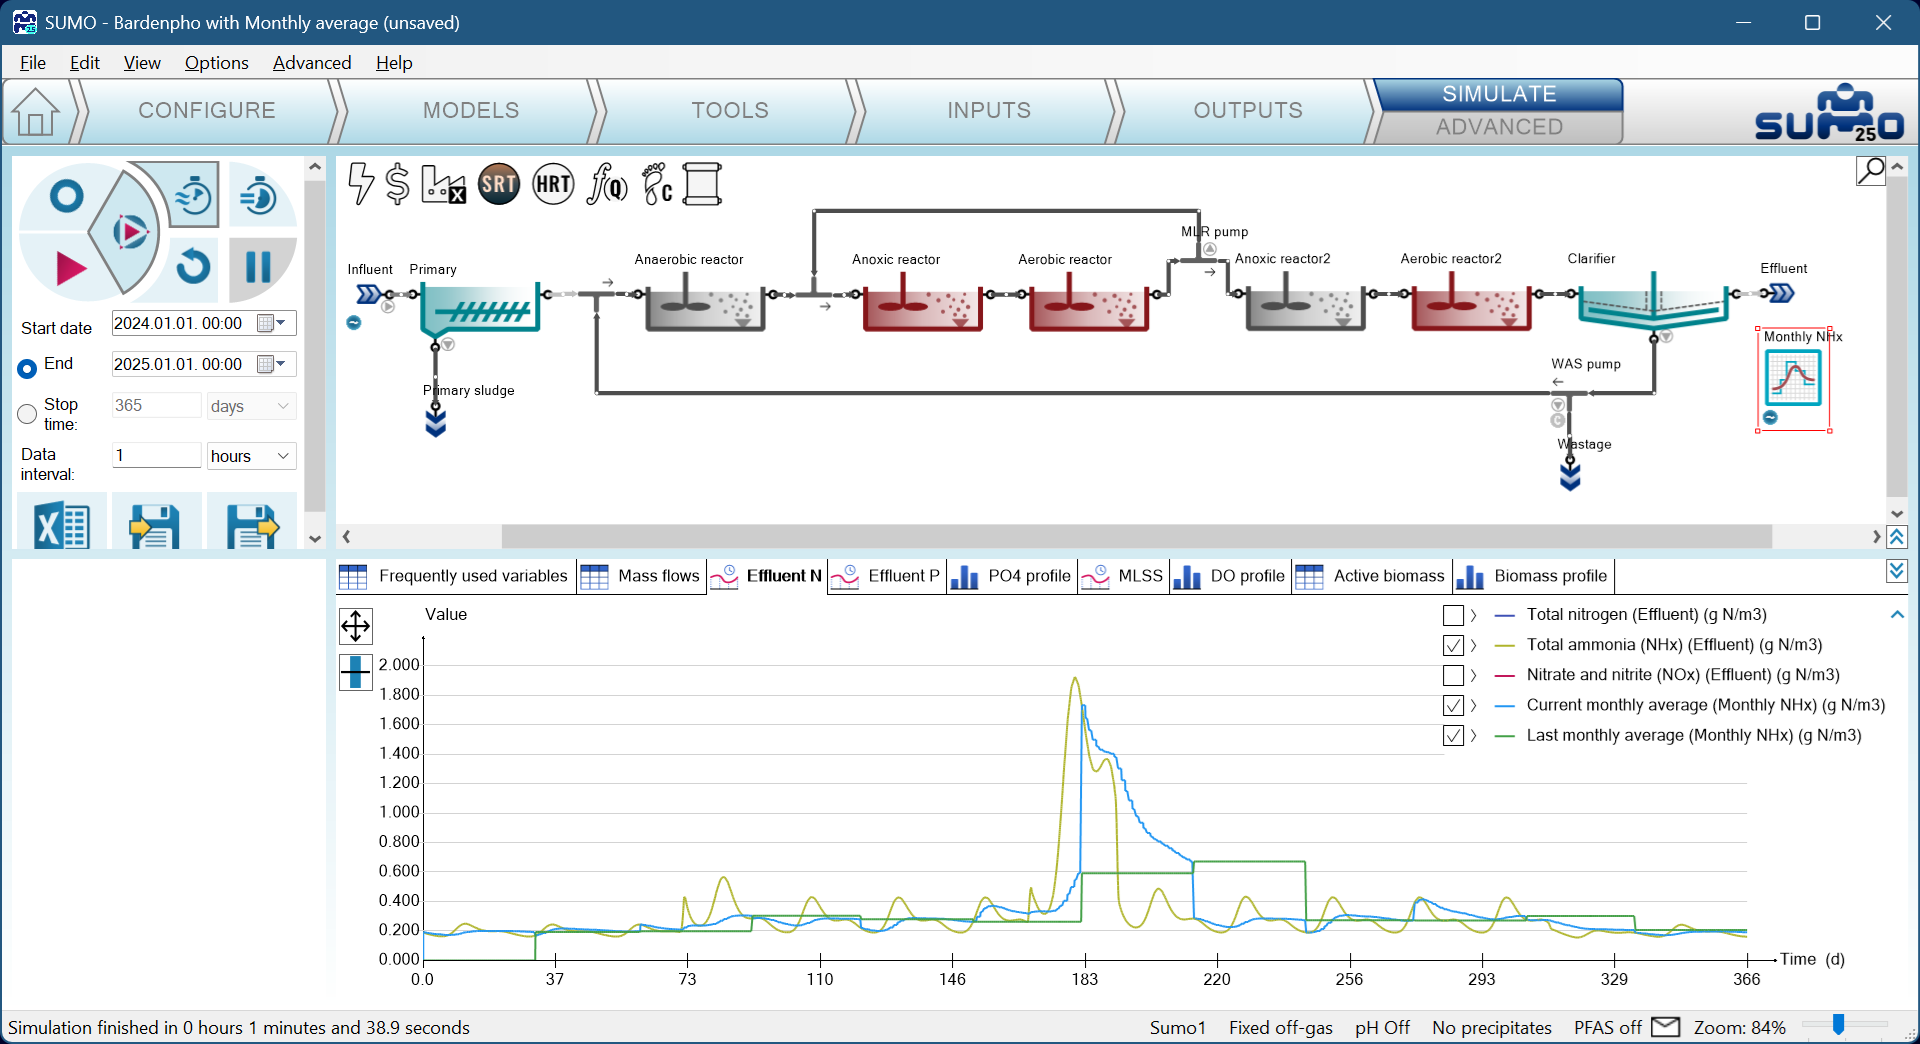
To demonstrate the behavior of the Monthly average statistical unit, start a simulation from the 1st of January, 2024 at 00:00, ending one year later (Figure 4.9.9).
Note: Date and time based dynamic input of influent or other process unit is not required but strongly recommended. A simple dynamic input always will start from day zero - thus a misalignment of month is possible if non-date-based dynamic tables are used in the layout.
¶ Moving average
The moving average collects values from a variable and calculates the moving average at the desired time window.
¶ Noise
The Noise unit generates an output variable from an existing one applying noise on the value.
¶ Response time
The Response time unit captures the sensor delay of a measurement unit thus allowing a more realistic control logic setup.
¶ Totalizer
The Totalizer unit integrates a variable over time, typically applied on mass flows.
¶ Next chapters
Chapter 5 – Energy and Cost calculations
Chapter 6 – Carbon footprint assessment
Chapter 7 – Design model
Chapter 8 – Examples