¶ Introduction
This page contains the detailed description of the process units available in Sumo. Or eventually will contain. We update this content continuously.
¶ Bioreactors
¶ SBR (Sequencing Batch Reactor)
¶ General description
The SBR process unit implements sequencing batch reactors in Sumo.
¶ Port specification
The SBR process unit has 3 ports as detailed in Table 3.1.
| Port name | Description |
|---|---|
| Inp |
The input port of the SBR is used for feeding water into the SBR tank. Currently there is no automatic mechanism in Sumo for having feed only in certain cycle phases; the user must provide the respective feeding pattern synchronized with the SBR cycle structure manually (e.g. via input files). |
| Decant |
The flow on the decantation port is controlled according to the SBR cycle organization – decanting from the SBR takes place through this port. The decantation port flow can be controlled manually as well; in this case the water quality appearing on this port is the bulk quality if the reactor is in mixed phase, and is equal to the supernatant quality if the reactor is not mixed. |
| Uflow |
The flow of the underflow port is controlled according to the SBR cycle organization – sludge wasting from the SBR takes place through this port. The underflow can be controlled manually as well; in this case, if the reactor is mixed, the bulk water quality is available, and the settled fraction of the reactor is available if no mixing takes place. |
Table 3.1 - Port specification of the SBR
¶ Parameters available for the user
Table 3.2, Table 3.3 and Table 3.4 provide the full parameter list available for the user. All these parameters are covered in the sections introducing the SBR operation in Sumo.
| Symbol | Name |
Default |
Unit |
|---|---|---|---|
| Atank | Surface |
1000.0 |
m2 |
| htank,max | Depth when tank is full |
5.00 |
m |
| hdecant | Decant to this level |
3.50 |
m |
Table 3.2 - SBR physical parameters
| Symbol | Name |
Default |
Unit |
|---|---|---|---|
| tcycle | Cycle length |
6 |
h |
| treact | React phase length |
4 |
h |
| tsettle | Settle phase length |
1 |
h |
| tdecant | Decant phase length |
0.9 |
h |
| twaste | Wasting phase length |
0.1 |
h |
| tidle | Idle phase length |
0 |
h |
| toffset | Cycle offset |
0 |
h |
| SRTtarget | Target SRT |
10 |
d |
| XTSS,decant,target | Effluent solids concentration |
20 |
g.m-3 |
| XTSS,sludge,target | Sludge concentration |
10000 |
g.m-3 |
Table 3.3 - SBR operational parameters
| Symbol | Name |
Default |
Unit |
|---|---|---|---|
| SO2,input | Dissolved oxygen (O2) setpoint input |
2 |
g O2/m3 |
| α | Alpha (clean water/wastewater) factor |
0.7 |
- |
| hsea | Elevation above sea level |
200 |
m |
| hdiff,floor | Diffuser distance from tank bottom |
0.2 |
m |
| ddiff | Diffuser floor density (diffuser area/tank area) |
0.1 |
m2/m2 |
| Adiff | Area per diffuser |
0.0373 |
m2 |
Table 3.4 - SBR aeration settings
¶ SBR cycle organization
The SBR operation is organized into cycles that are built from phases according to Table 3.5. The length of the cycles can be given in parameter tcycle in hours. Table 3.5 contains a short summary of the cycle phases. The phases are detailed in the sections below.
| Phase name | Reactive | Mixed |
|---|---|---|
| reaction phase | yes | yes |
| settling phase | no | no |
| decanting phase | no | no |
| idling phase | no | no |
Table 3.5 - SBR cycle organization as implemented in Sumo
According to the current implementation, biological reactions occur only in the reaction phase, where the reactor content is completely stirred.
¶ Reaction phase
As it can be seen in Table 3.5 there is no separate feeding phase. Instead of a dedicated feeding phase a certain part of the reaction phase can be used for feeding the reactor. Currently there is no automatic feeding mechanism in Sumo for having feed only at certain reaction phases; the user must provide the respective feeding pattern synchronized with the SBR cycle structure, manually (e.g. via input files).
During the reaction phase all the biological reaction equations according to the user-determined biological model are calculated and the respective state and calculated variables are available through the general interfaces described in the user manual.
¶ Settling phase
The settling method implemented currently in Sumo is quite simple: The settling efficiency is determined by the user by providing the desired effluent TSS value at the overflow and pumped ports (i.e. TSS in the settler supernatant) as well as the desired TSS concentration in the settled sludge.
The settling itself occurs instantaneously as the reactor enters the settling phase. There is no mixing and no biological reactions take place during the settling phase. The supernatant water is available via the overflow and pumped ports, whereas the settled sludge is available via the underflow port.
The length of the settling phase is determined by the parameter tsettle (in hours).
¶ Decanting phase
Sumo currently works with fixed volume decanting. During the decanting there is no mixing in the reactor so there’s two phases available via the respective ports. The length of the decanting phase is determined by the parameter tdecant, whereas the volume to be decanted is determined by the actual volume minus the surface multiplied by the decant target level(in m3).
Sludge wasting also occurs in the last minutes of the decanting phase. The wasting phase duration is determined by the parameter twaste (h). The wasted sludge amount (g/d) in one wasting phase is also determined by the user from the actual TSS mass divided by the target SRT and the number of cycles. The waste sludge volume and flow rate is determined using the sludge mass to be wasted, the settled sludge suspended solids concentration and the duration of the wasting period.
¶ Idle phase
The length of the idling phase is the difference between the total cycle length and the sum of the reaction, settling and decanting phase duration. Neither mixing nor biological reactions take place during the idling phase.
¶ BAF (Biologically Aerated Filters )
¶ Key points
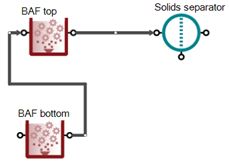
- Upflow 2 vertical zone BAF complex unit with aeration either in bottom or top
- 1D layered heterogenous biofilm model with n layers
- Fixed film thickness as gTSS/m2 and Film thickness input
- Works with any biological model in Sumo format
|
|
¶ Model description
This complex unit is an upflow biological filter with 2 vertical biofilm reactor zones, with aeration either in the bottom or mid height. Backwash is simulated as a continuous process flow.
The volume and the corresponding depth of the bottom reactor compartment are determined by the user input fraction of the total volume. As for the top compartment, the remaining fraction will take up the rest of the specified total volume and depth.
BAF media characteristics typically differ from those used in the underlying biofilm subunits and are mapped there from the main unit's input parameters. The media is assumed to be flooded in this type of process unit, therefore the carrier filling degree is hardcoded to be 1 m3/m3, with the height of water above the media depending on the water displaced by carrier.
BAF units with bottom air supply location are of a fully aerated configuration – the aeration gas composition is defined for the bottom, and the input gas composition of the top compartment is the same as that of the off-gas from the bottom.
With air supply from the middle, a BAF unit is in a denitrifying configuration – there is no air introduced to the bottom, the aeration gas composition is defined for the top compartment.
Complex units with a vertically layered gas phase inside underlying subunits require balance equation extensions for any compartment other than the bottom: For fully aerated BAF units, air is introduced at the bottom; thus
- input gas mass flows to the top have to take into account the output gas from the bottom,
- the output gas volumetric flow must include not only the top's gas transfer in volumetric unit but the off-gas flow from the bottom as well.
For BAF units with denitrifying configuration, air is introduced at the top; so
- along with the off-gas from the bottom, the aeration gas mass flow must also be added for the top input gas,
- apart from the gas transfer in volumetric unit from the top, the outgoing volumetric flow accounts for the air flow from the top, as well as the off-gas from the bottom.
A vertically staged gas phase within subunits of a complex unit requires saturation depth correction for any compartment other than the top: the hydrostatic pressure increases with liquid depth, so the entire height of the water column above a given compartment must be added to the effective saturation depth of its own section (by default half of the compartment depth).
¶ Example file
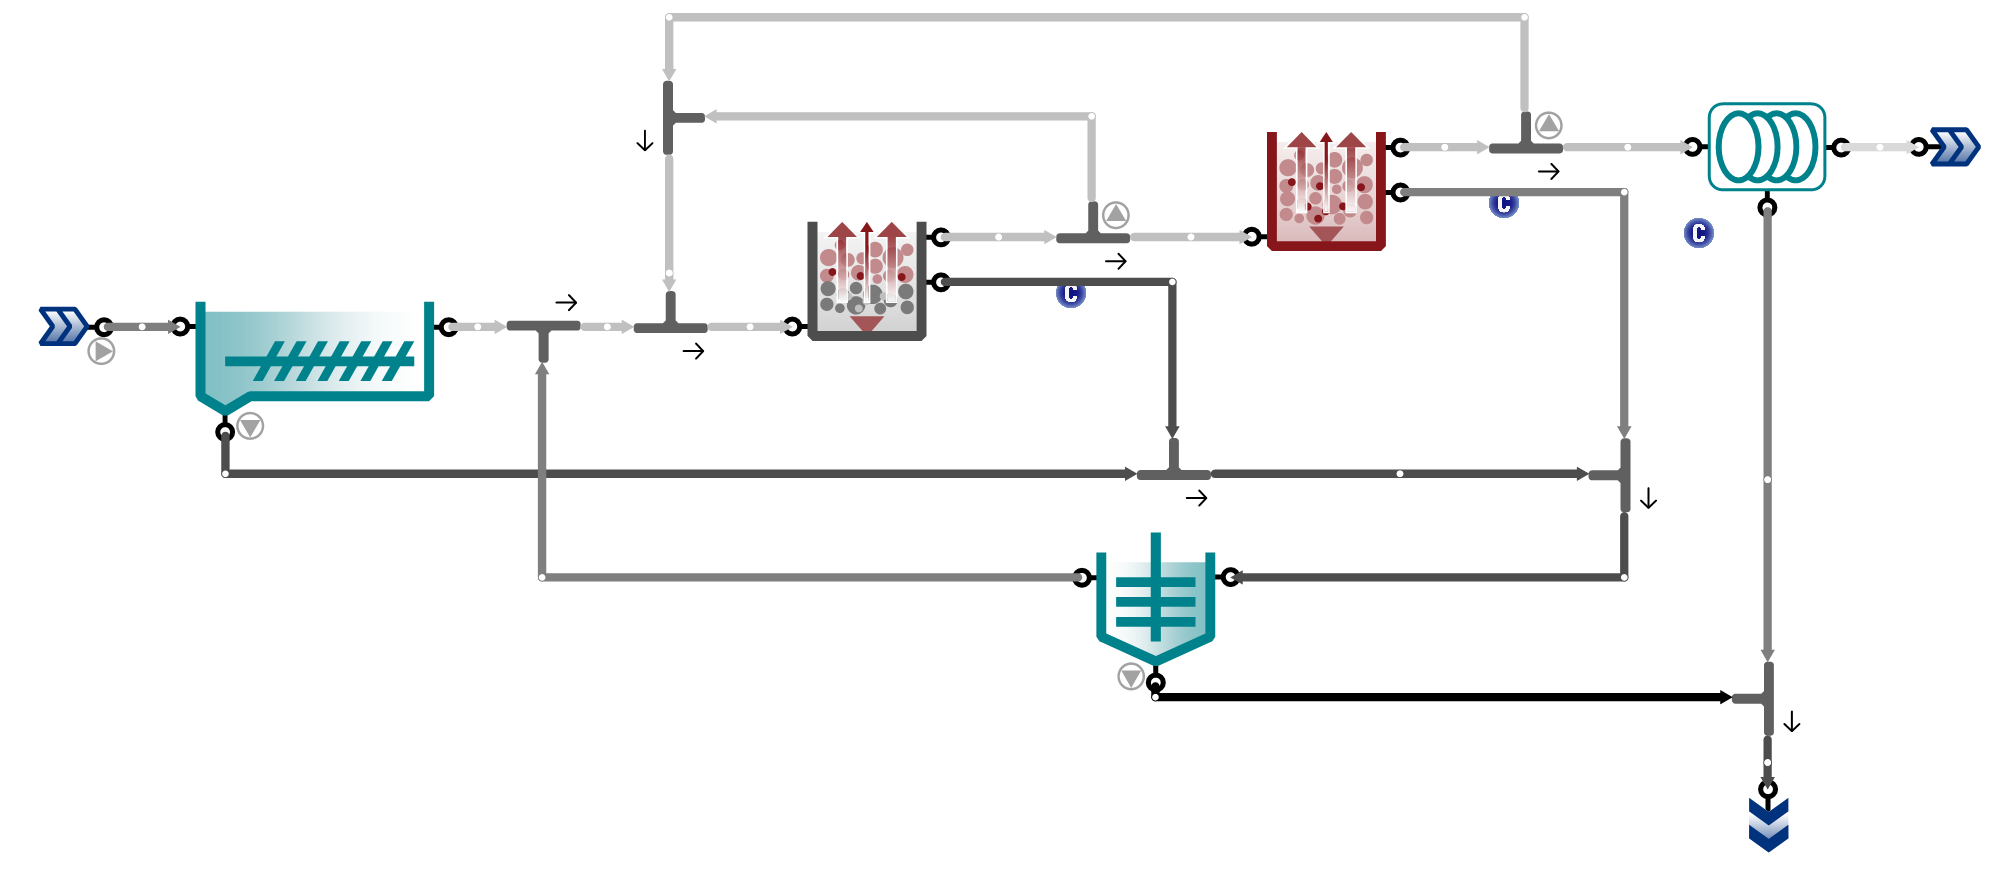
Below is the configuration setup used as an example (it can be found in the home page – BAF plant.sumo). Here two BAF units are designed in series to treat settled wastewater.
¶ Input tab

¶ Results
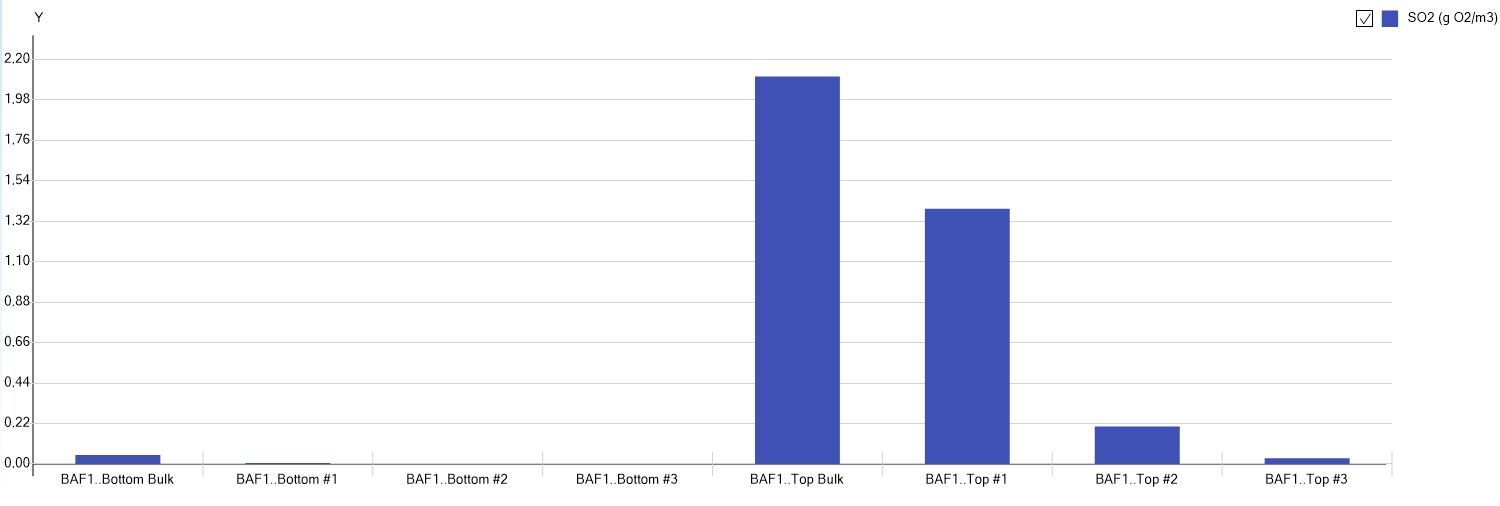
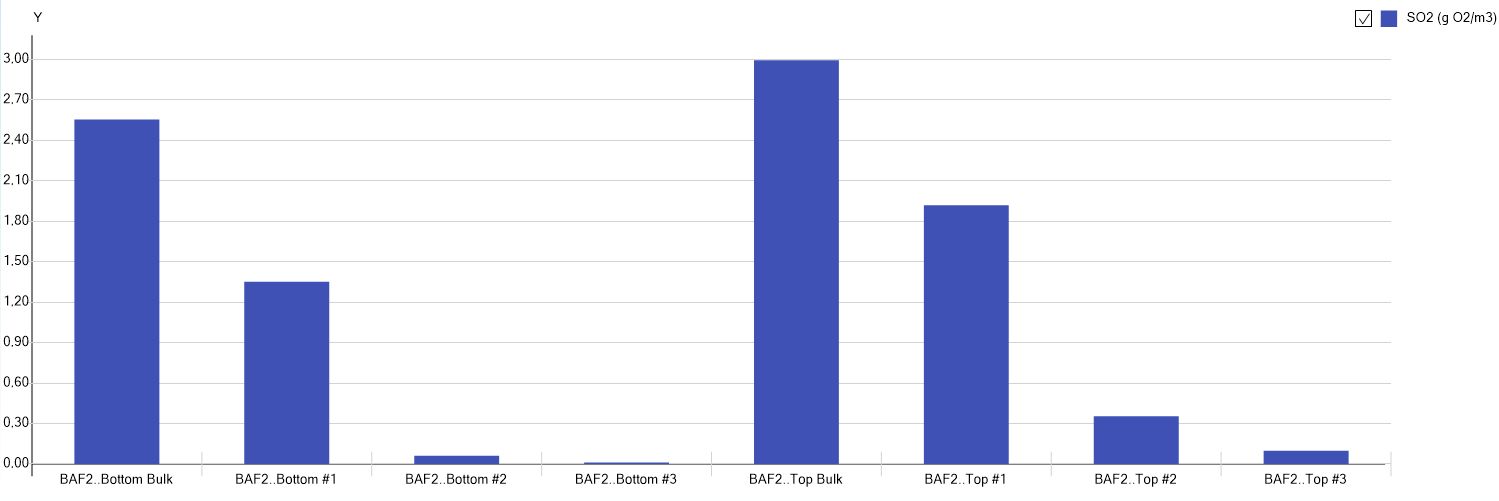

¶ UASB (Upflow anaerobic sludge blanket reactor)
The UASB model in Sumo was developed in two versions with different complexity levels.
¶ a) Completely mixed approach
This is a complex unit of completely mixed reactor with suspended growth, a settling function and a wastage pump. In this type of unit, the TSS concentration in the reactor is assumed to be homogeneous, and it is controlled empirically to the user-defined target by adjusting the solids percent removal of the settling function, that may not capture the specified non-settleable fraction of the reactor TSS. The sludge underflow of the settling function is back-mixed according to the user-input flow fraction. The volumetric flow of the wastage pump is determined by the user-specified sludge mass flow target, based on the TSS concentration in the completely mixed process unit model.
¶ b) Three compartment approach
This is a three vertical compartment-based complex unit with suspended growth, settling functions and a wastage pump. The volume and the corresponding depth of the sludge bed and sludge blanket reactor compartments are determined by the user input fraction of the total volume. As for the settling zone compartment, the remaining fraction will take up the rest of the specified total volume and depth. In this type of unit the distribution in TSS concentration between the sludge bed, sludge blanket and settling zone is estimated by a logistic function, and the average TSS is targeted by manipulating the solids percent removal of each compartment's settling function, according to the distribution curve. TSS in the sludge bed is driven by the targeted average TSS, but regulated using a function striving to ensure that the input non-settleable solids fraction is not captured. TSS in the sludge blanket and settling zone is adjusted based upon the actual average TSS concentration, to keep a reasonable sludge distribution even if the sludge bed TSS falls short of the target range.
In this three-compartment concept, user-determined volumetric flow portions of the influent are assumed to short-circuit to the sludge blanket and settling zone directly. The sludge underflow of the settling function is back-mixed at each compartment according to the user-input flow fraction. The volumetric flow of the wastage pump is determined by the user-specified sludge mass flow target, based on the TSS concentration in the sludge bed (wasted from the lowermost compartment). Complex units with a vertically layered gas phase inside underlying subunits require balance equation extensions for any compartment other than the bottom: as for UASB with a compartmented model concept, the gas moves through the sludge blanket and the settling zone; thus:
- input gas mass flows to the sludge blanket and settling zone have to take into account the output gas from the sludge bed and sludge blanket, respectively,
- the off-gas volumetric flow sludge blanket and settling zone must include not only their own respective gas transfer in volumetric unit, but the off-gas flow from the sludge bed and sludge blanket, respectively, as well.
A vertically staged gas phase within subunits of a complex unit requires saturation depth correction for any compartment other than the top: the hydrostatic pressure increases with liquid depth, so the entire height of the water column above a given compartment must be added to the effective saturation depth of its own section (by default half of the compartment depth).
¶ Pond and Lagoon modeling - Gen2 vs Gen3
Gen2 and Gen3 describe two different modeling concepts applied to Pond and Lagoon systems. The Gen2 model was originally developed to simulated aerated facultative lagoons whereas the Gen3 model was developed for algal systems. The Gen3 Pond model should be used in most cases for both Ponds and Lagoons as it is a more advanced and powerful model. For example, unlike the Gen2 model, the Gen3 model includes algal photosynthesis and heat exchanges/temperature modeling. The Gen2 model remains available for legacy users of this modeling approach.
¶ a) Gen2: Flow-based pond layer exchanges
¶ General description
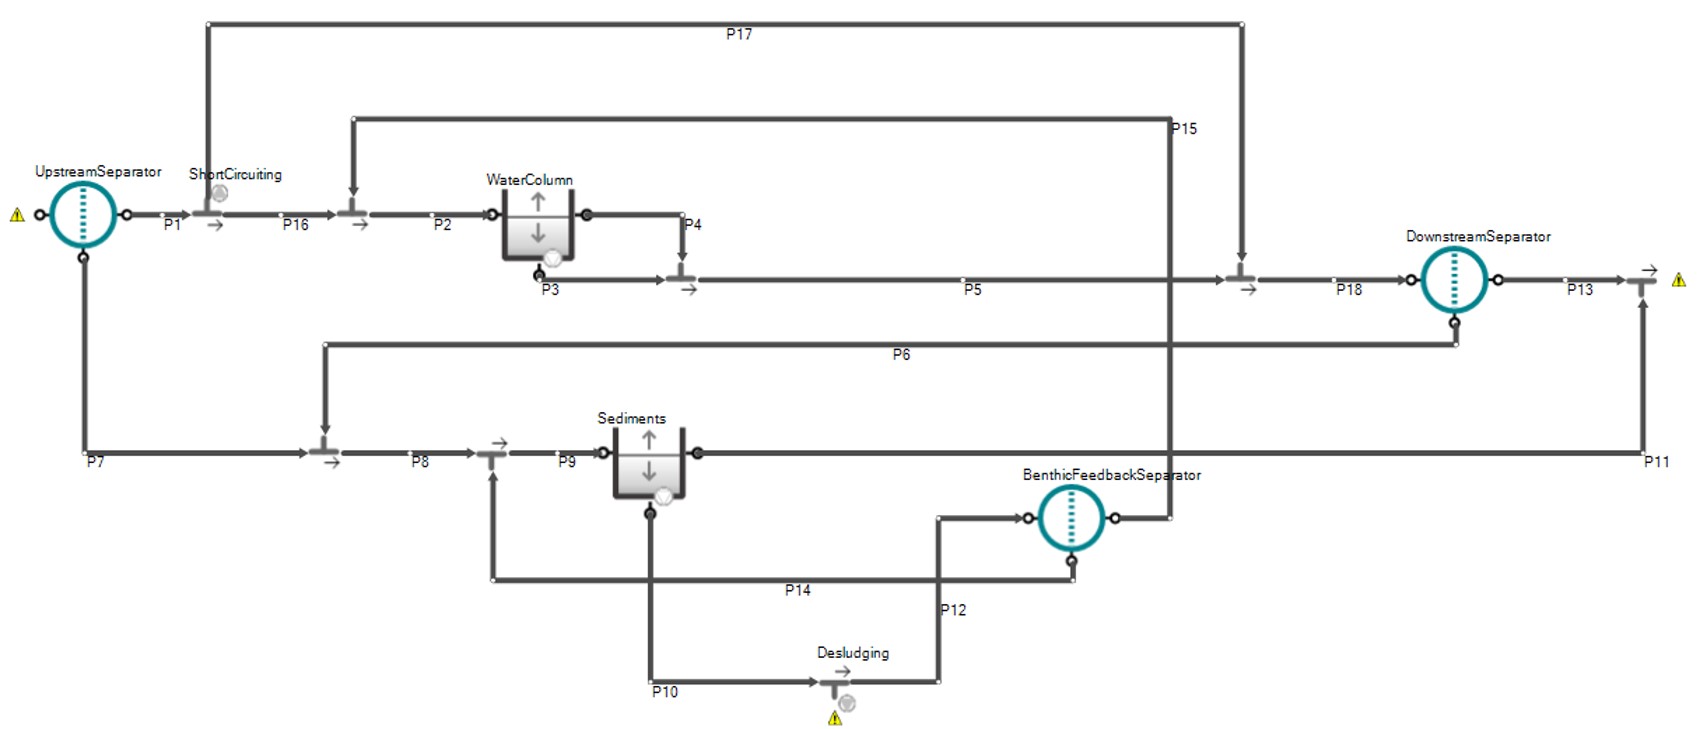
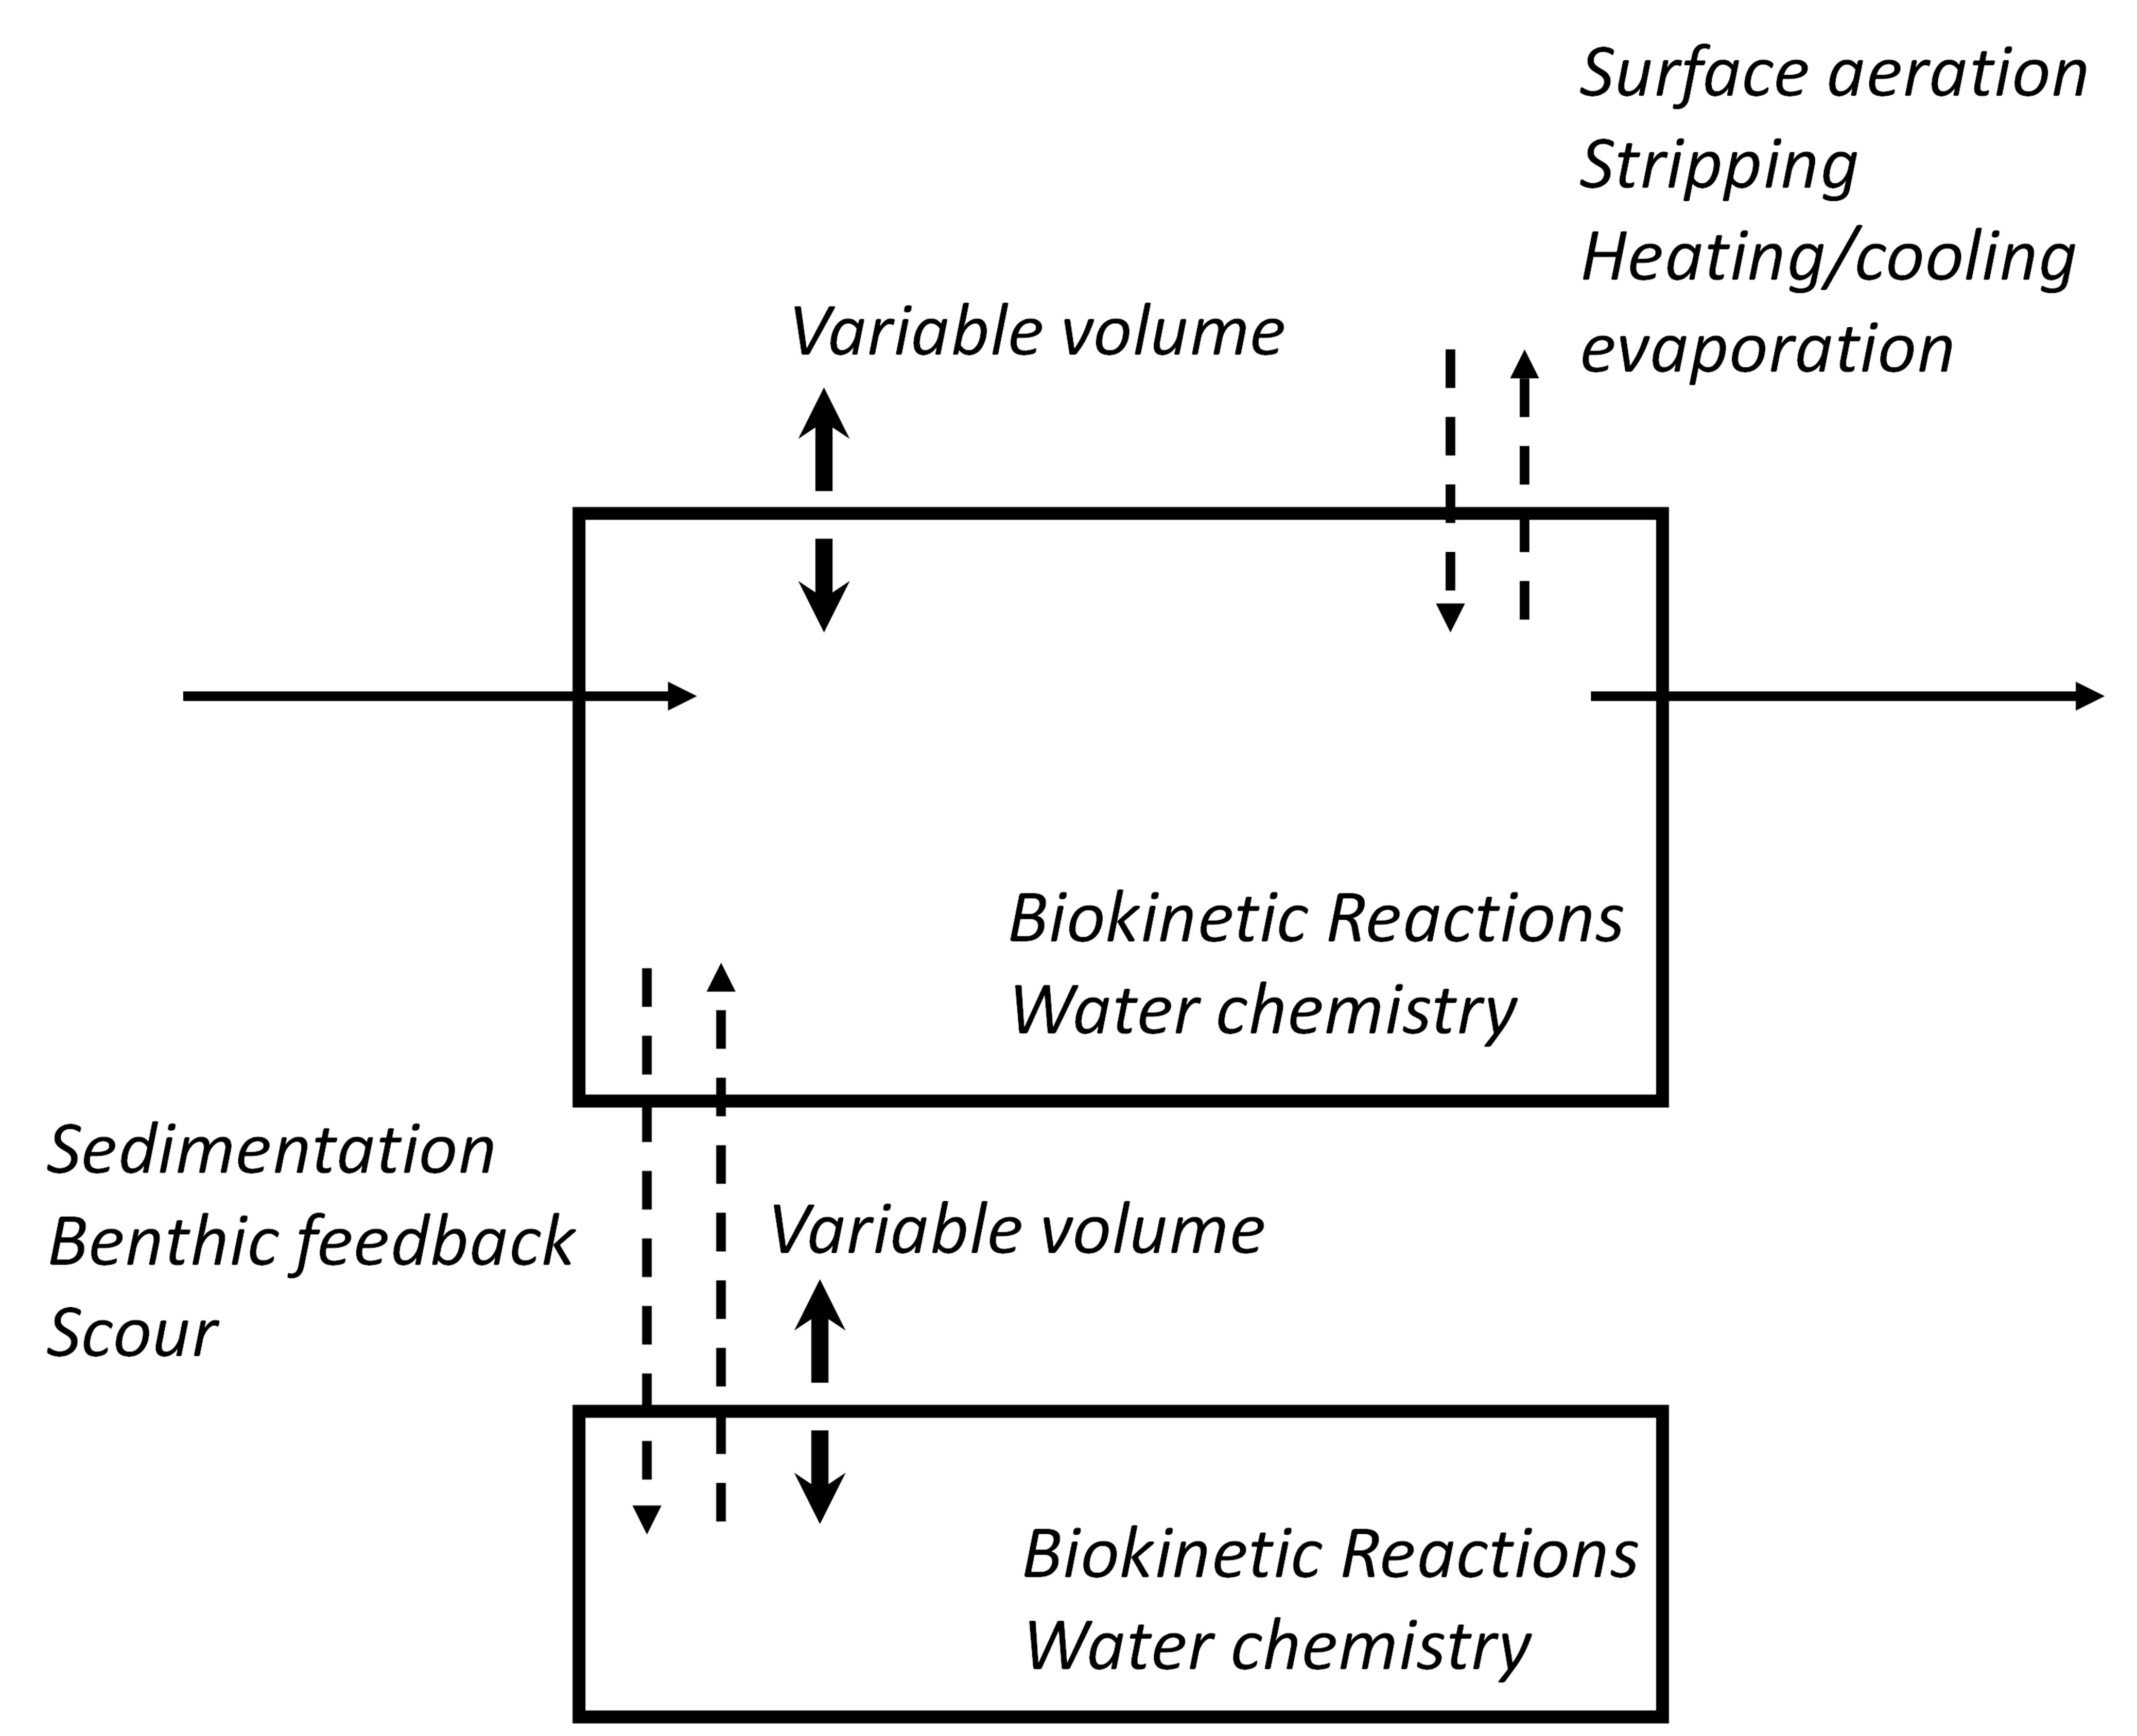
The Gen2 pond/lagoon model is a “complex unit” utilizing two variable volume bioreactors (EQ tanks) to represent (1) the Water Column and (2) the Sediments or Sludge layer. As shown in the Figure below, the model includes a number of pipe connections (P1 through P18) to represent exchanges between the Water Column and the Sediment layer. Exchanges between layers are modeled using piped flows and this is different from the 3rd generation pond model which models exchanges between layers explicitly as “fluxes”. To illustrate, settling of solids from the Water Column to the Sediment layer is modeled without any bulk movement of liquid volume (flow) in the Gen3 model but does require flow in the Gen2 model through pipes P6 and P7. The Gen3 pond model is described in the next section.
¶ Model transport processes
Settling of solids from the Water Column to the Sediment layer:
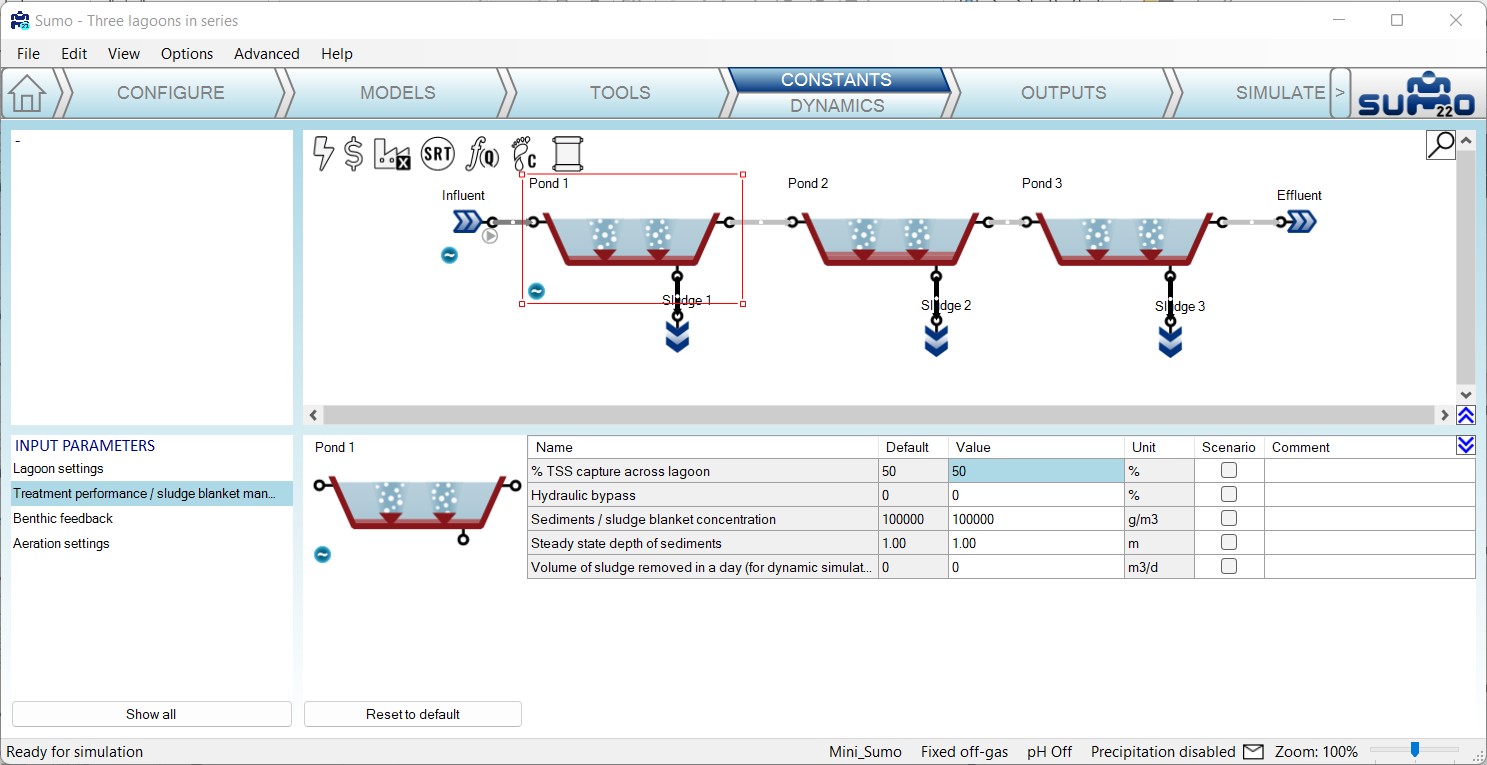
In the default model configuration, Pond TSS removal is modeled downstream of the Water Column in P6. Solids capture through P7 is set to zero but can be changed in the underlying PU file. This is an advanced user feature. Pond TSS removal is specified by the user in the “Treatment Performance / Sludge Blanket Management” input form shown in the Figure below.
Short-circuiting or bypass:
Flow around the Water Column is modeled in P17. This flow percentage is specified in the “Treatment Performance / Sludge Blanket Management” input form shown in the above Figure.
Variable depth of Water Column and Sediments:
As Sediments accumulate at the bottom of the Pond, the decrease in Water Column depth and volume is modelled by pumping flow through P3. Pumping of flow from Sediments through P10 is modeled to achieve target sediments solids concentration as specified in “Treatment Performance / Sludge Blanket Management” input form shown in Figure 2. The default value for this parameter is 100,000 mg/L (10% solids) but this may vary based on site specific factors.
Benthic feedback from Sediments to Water Column:
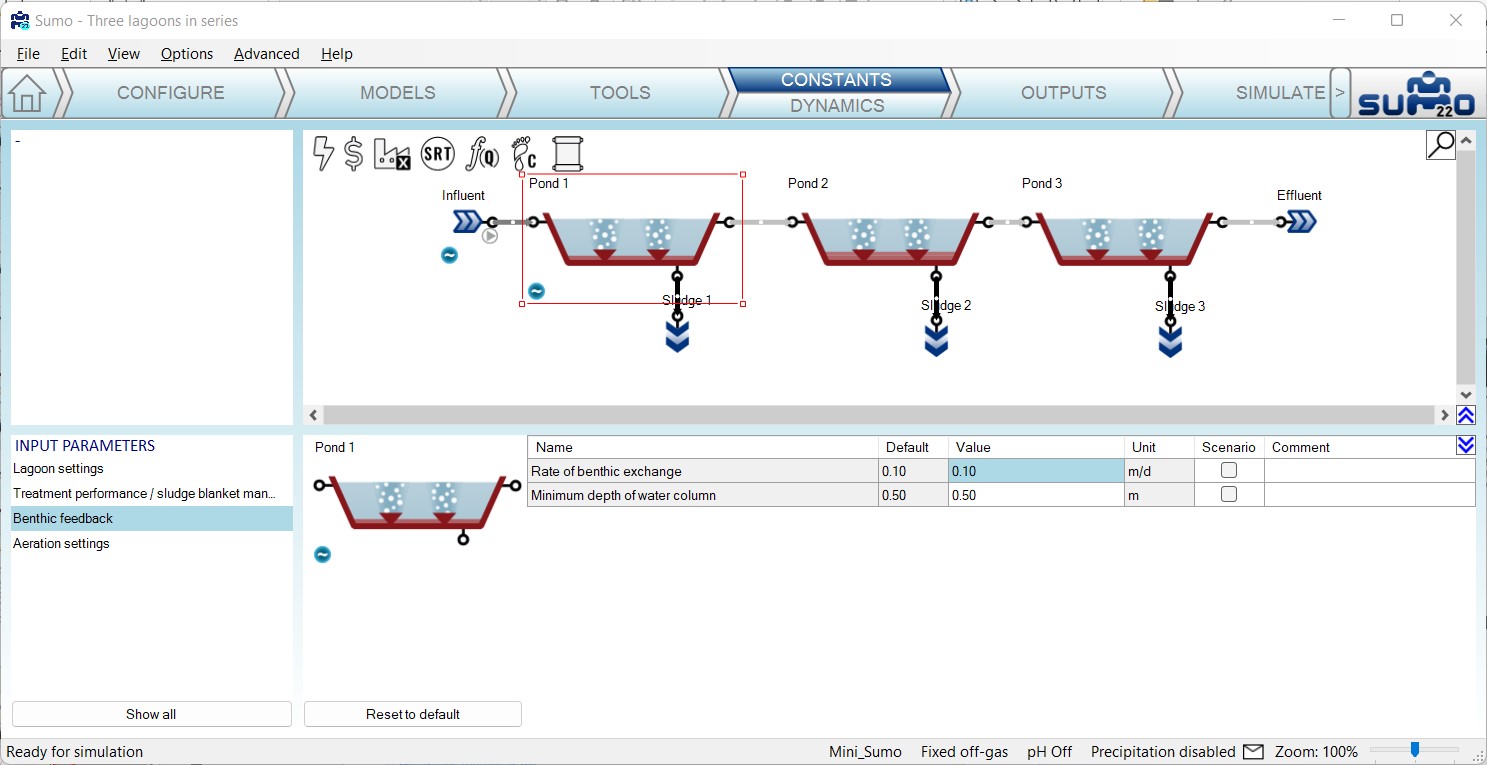
Soluble components including ammonia, phosphate and volatile fatty acids (VFA) are carried from the Sediments to the Water Column in P15. Note that, in the default model configuration, only soluble components are returned and there is complete retention of particulate material in the Sediment layer in the “BenthicFeedbackSeparator”. The rate of benthic feedback from Sediments to the Water Column is specified as the rate of “Rate of benthic exchange” in the “Benthic Feedback” input form shown in the Figure below. Note that at higher rates of benthic exchange you should observe a decrease in ammonia and phosphate concentrations in the Sediments zone.
Scouring of the Sediments:
In cases where the Sediment layer has reached its maximum allowable depth, scouring of Sediments returns both particulate and soluble material to the Pond effluent through P11 and the % TSS capture specified by the user will likely not be achieved. The maximum allowable depth of the Sediment layer is defined with respect to the Minimum depth of Water Column defined in the “Benthic Feedback” input form shown in the above Figure.
Desludging:
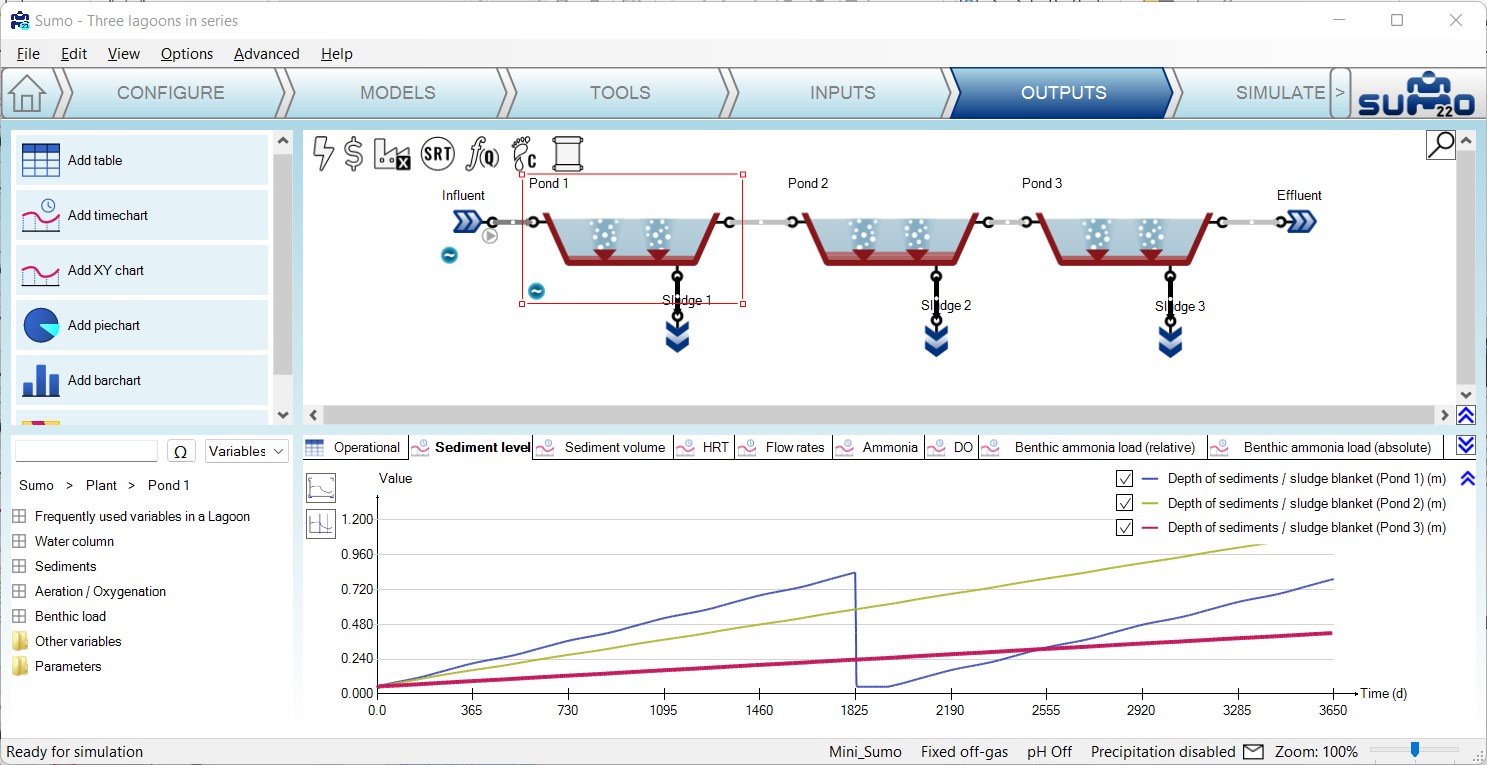
The “Desludging” flow splitter connected to P10 can be used to simulate manual removal of sludge from the Sediment layer. In “Steady state”, the model will calculate the desludging flow required to achieve the target “Steady state depth of sediments” specified in the “Treatment Performance / Sludge Blanket Management”. In dynamic simulations, the user must specify the “Volume of sludge removed in a day” which by default is zero. This value can be specified dynamically to simulate desludging after several years of operation as demonstrated in the example file “Three lagoons in series” and shown in the Figure below.
Pond Reactive Model:
The Water Column and the Sediments are compatible with all of the standard Sumo model libraries though Mini_Sumo is recommended for fastest simulation times. The difference in reactions modeled in the Water Column and Sediment layer relate only to the availability of oxygen, hydraulic and solids residence times and solids concentrations. In most cases the Sediment layer will generate methane and the Water Column may be aerobic or anaerobic based on the ratio of BOD loading to Pond surface area and mechanical aeration.
Pond Aeration:
Oxygen transfer is modeled into the Water Column through a combination of natural surface transfer, mechanical surface aeration or subsurface diffused aeration. The default diffused aeration model is “Coarse bubble” though this can be modified in the “Configure” step of the SUMO model setup. The airflow rate or mechanical aeration energy input may be changed in the “Aeration settings” input form.
¶ b) Gen3: Flux-based pond layer exchanges
¶ General description
The default depth (1.5 m) and aeration intensity (0.5 W/m3) of the Gen3 model is representative of a facultative pond in which algal photosynthesis and natural surface aeration are the primary drivers for oxygenation. However, these defaults can be user specified to simulate a wide range of waste stabilization pond designs including anaerobic ponds and lagoons with higher mechanical aeration intensities.
The Gen3 pond/lagoon model in SUMO22 explicitly models settling of particulate material from the Water Column to the Sediments as a flux and thus is a simpler and more powerful modeling approach than the Gen2 model. Unlike the Gen2 model, it includes algal photosynthesis and heat exchanges for dynamic simulation of temperatures.
¶ Transport model
The model input parameters from the SUMO “INPUT” tab are presented in the following tables. Note that the “Heat transfer parameters” only appear if the option “Calculate heat loss and gain” is selected in the “CONFIGURE” tab.
¶ Volumes and hydraulics
The physical input parameters for the Gen3 pond model are presented in the Table below:
| Name | Default | Units | Comments |
|---|---|---|---|
| Initial liquid volume | 96,000 | m3 | Liquid volume at simulation start. |
| Maximum liquid volume | 96,000 | m3 | Default volume set to provide 4 days of hydraulic retention time with the default influent flow of 24,000 m3/d. Change to represent site conditions. |
| Maximum liquid depth | 1.5 | m | Surface area is calculated based on volume and this depth. |
| Initial volume of sediments | 6,400 | m3 | Volume of sediments at simulation start. |
¶ Settling rates
The model parameters which govern settling processes in the Gen3 model are presented in the Table below:
| Name | Default | Units | Comments |
|---|---|---|---|
| Settling rate of particulates | 0.5 | d-1 |
First-order settling rate of all particulate material except heterotrophs, nitrifiers and algae. |
| Settling rate of ordinary heterotrophs | 0.5 | d-1 |
First-order settling rate of heterotrophs. |
| Settling rate of nitrifiers | 0.05 | d-1 |
First-order settling rate of nitrifiers. |
| Settling rate of algae | 0.05 | d-1 |
First-order settling rate of algae. |
| Non settleable TSS | 15 | g.m-3 |
As Water Column TSS concentration approaches this value, all particulate material settling rates are switched to zero. By raising this parameter value, the Water Column TSS concentration can be calibrated to a desired value. |
| Sediment layer fraction for scouring process | 0.8 | unitless |
As the ratio of Sediment volume to total liquid volume approaches this value, release of particulate material from the Sediment layer to the Water Column (scouring) is switched on. |
¶ Sediments or sludge layer
The model parameters which govern settling processes in the Gen3 model are presented in the Table below:
| Name | Default | Units | Comments |
|---|---|---|---|
| Concentration of total solids or dry matter (XDM) in sediments | 0.1 | - |
The volume of the sediments will be calculated based on the mass of solids in the layer divided by this value. The default value of 0.1, or 10% dry solids, corresponds to an equivalent concentration of 100,000 g/m3. |
| Volume of sediments removed per day by desludging | 0 | m3.d-1 |
The volume of solids removed through desludging per day. This parameter is only used in dynamic simulations and is best simulated as a dynamic input. |
| Steady state depth of sediments | 0.1 | m |
During steady state simulations, the model will calculate the equivalent average daily sludge removal required to achieve this sediment depth. |
¶ Benthic release
The model parameters which govern benthic release in the Gen3 model are presented in the Table below. Benthic release refers to the exchange of soluble material from the Sediments to the Water Column.
| Name | Default | Units | Comments |
|---|---|---|---|
| Diffusion constant for solubles in sludge blanket | 1.00E-04 | m2.d-1 |
Governs the rate of diffusion of soluble components from the Sediments to the Water Column. |
| Mass transfer resistance layer at interface of sediments and water column | 0.01 | m |
Used in calculating the rate of diffusion of soluble components from the Sediments to the Water Column. |
| Ratio of saturation for ebullition in water column | 1.5 | unitless |
Bubble forming of oxygen generated from photosynthesis is modeled at a multiple of the saturation concentration calculated from liquid temperature and atmospheric partial pressure. |
| Ratio of saturation for ebullition in sediments | 10 | unitless |
Bubble forming of methane generated from anaerobic digestion is modeled at a multiple of the saturation concentration calculated from liquid temperature and atmospheric partial pressure. |
¶ Environmental parameters
The environmental model parameters which govern photosynthesis and heat exchanges in the Gen3 model are presented in the Table below.
| Name | Default | Units | Comments |
|---|---|---|---|
| Solar radiation for algal photosynthesis - depth averaged | 100 | W.m-2 |
Depth averaged solar radiation in wavelength spectrum useful for photosynthetic activity. Specify as a dynamic input to account for diurnal and seasonal variations. |
| Optimal irradiation for photosynthesis - depth averaged | 100 | W.m-2 |
Solar radiation for optimal photosynthetic activity. |
| TSS concentration for calculating light extinction switching factor | 100 | g.m-3 |
Accounts for shading effect. For highly loaded ponds with Water Column TSS concentrations above this value, no photosynthetic growth will be simulated. For low loaded pond, algal growth will occur until Water Column TSS (including algal component) reaches this value. This value varies based on depth and can be used as a calibration parameter. |
| Solar radiation for pond heating | 200 | W.m-2 |
Solar radiation used in heat model. |
| Wind speed | 10 | km.h-1 |
Used for calculating convection in heat model. |
| Air temperature | 15 | °C |
Used in heat model and aeration model. |
| Ground temperature | 15 | °C |
Used in heat model. |
| Relative humidity | 70 | % |
Used in heat model. |
¶ Mechanical aeration settings
The model parameters which govern mechanical aeration in the Gen3 model are presented in the Table below.
| Name | Default | Units | Comments |
|---|---|---|---|
| Wire power of aeration system | 50 | kW | |
| Standard aeration efficiency | 1.5 | kg O2/kWh | |
| Motor efficiency | 70 | % | |
| Alpha (wastewater/clean water) factor | 0.9 | unitless | |
| Elevation above sea level | 200 | m |
¶ Heat transfer parameters
The model parameters which govern heat exchange in the Gen3 model are presented in the Table below. Note that this table only appears if the option “Calculate heat loss and gain” is selected in the SUMO “CONFIGURE” tab.
| Name | Default | Units | Comments |
|---|---|---|---|
| Heat transfer velocity of the wind of walls | 8.37E+04 | J.m-2.K | |
| Stefan Boltzman constant for long wave atmospheric radiation heat term | 5.67E-08 | J.m-2.s-1.K-4 | |
| Emissivity of water surface for long wave atmospheric radiation heat term | 9.70E-01 | unitless | |
| Atmospheric radiation factor for long wave atmospheric radiation heat term | 8.50E-01 | unitless | |
| Reflectivity of water for long wave atmospheric radiation heat term | 3.00E-02 | unitless | |
| Heat capacity of air | 1.00E+00 | J.g-1.K-1 | |
| Heat of biological reaction | 8.00E-03 | MJ.g COD-1 |
¶ Biological model
The Gen3 pond model is compatible with all the standard SUMO biokinetic models including Sumo1, Sumo2, Mini_Sumo, Sumo2C, Sumo2S and Sumo4N with the added feature that it also includes algal photosynthesis.
Growth is dependent on the user input "Solar radiation for algal photosynthesis - depth averaged" which may vary depending on time of day (there is no sunlight at night), latitude and season, cloud cover as well as the depth of the pond. It is the user's responsibility to account for these factors when specifying the depth averaged solar radiation. Specifying diurnal and seasonal variations of solar radiation is possible using Input Dynamics.
The effect of shading in the water column due to influent particulate material, as well as algae itself, is accounted for using the parameter "TSS concentration for calculating light extinction switching factor". When the simulated TSS concentration in the water column approaches this value, the growth rate of algae switches to zero regardless of what the specified value is for "Solar radiation for algal photosynthesis - depth averaged".
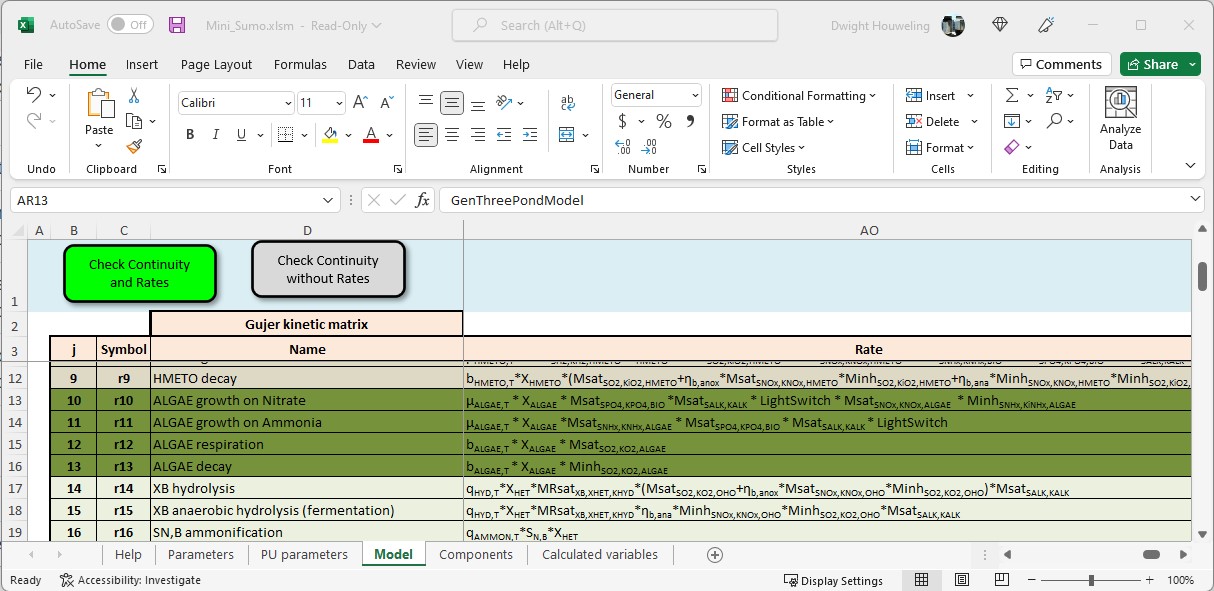
Growth of algae is accompanied by assimilation of ammonia as a nutrient source unless ammonia becomes limiting in which case nitrate is assimilated. Phosphorus and carbon dioxide are also assimilated for growth.
Respiration of algae is simulated when oxygen is available. Respiration means the conversion of algae into water, CO2, ammonia and phosphate by oxydation using oxygen. In the absence of oxygen, the respiration rate switches to zero and decay of algae is switched on. Decay means the lysis of algae into particulate organic material, ammonia and phosphate and occurs in the pond sediments where oxygen is absent.
¶ Mass balances
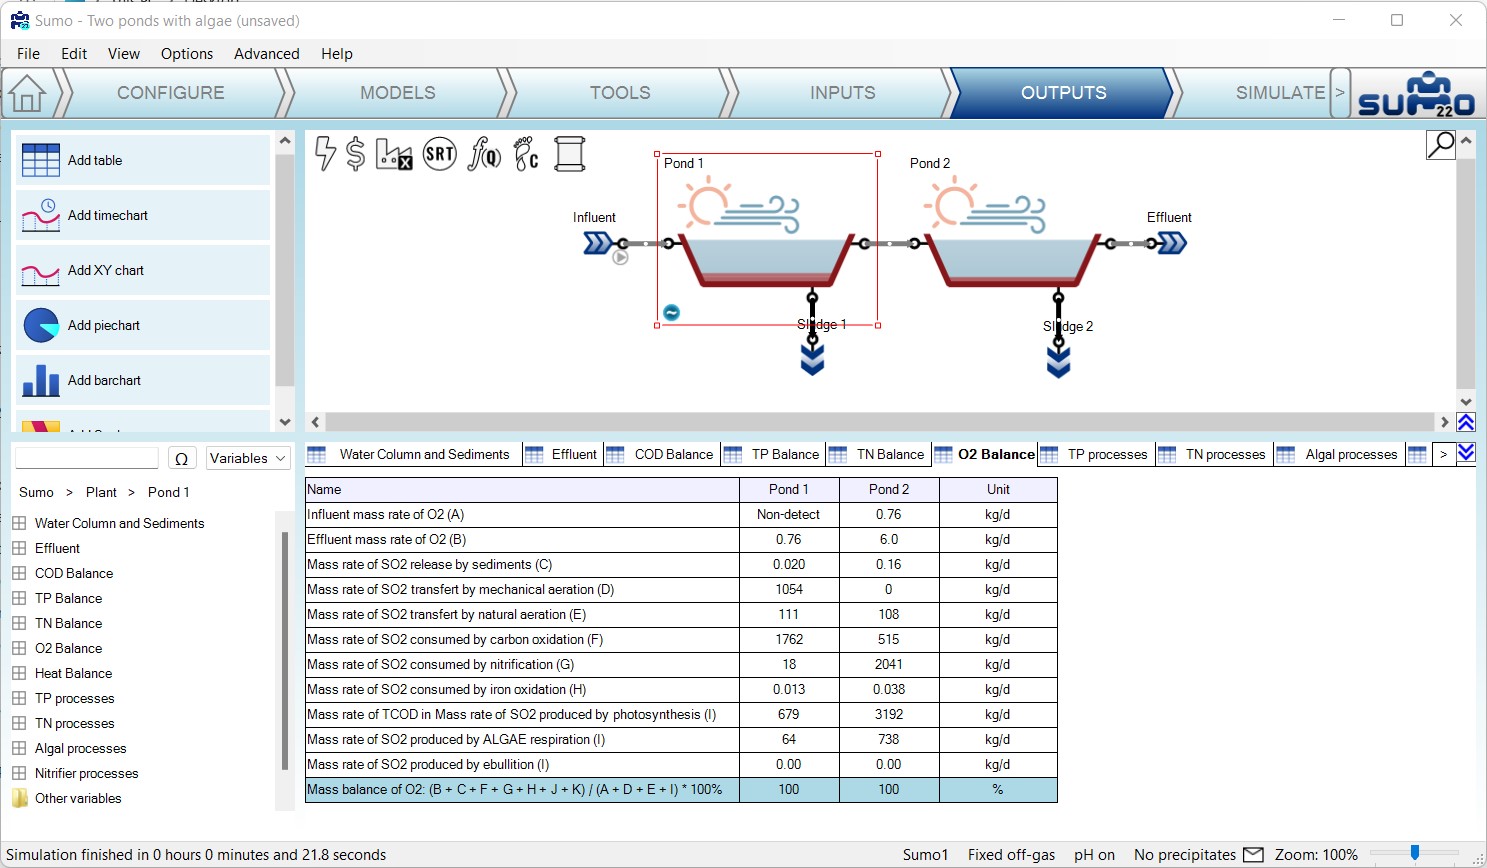
Mass balances for COD, TP, TN, O2 and Heat are provided for convenient output to tables, bar charts or pie charts. These data represent the mass balance for the Water Column and not the entire Pond. As illustrated in the Figure below, the bottom line item should be at or near 100% when the pond is at steady state.
In addition to indicating whether the Pond is in steady state, this table can indicate the most significant processes governing Pond behavior. In this case we see that mechanical aeration (line item D) is more significant than photosynthesis (line item I) in Pond 1 but not in Pond 2.
¶ Conversion processes
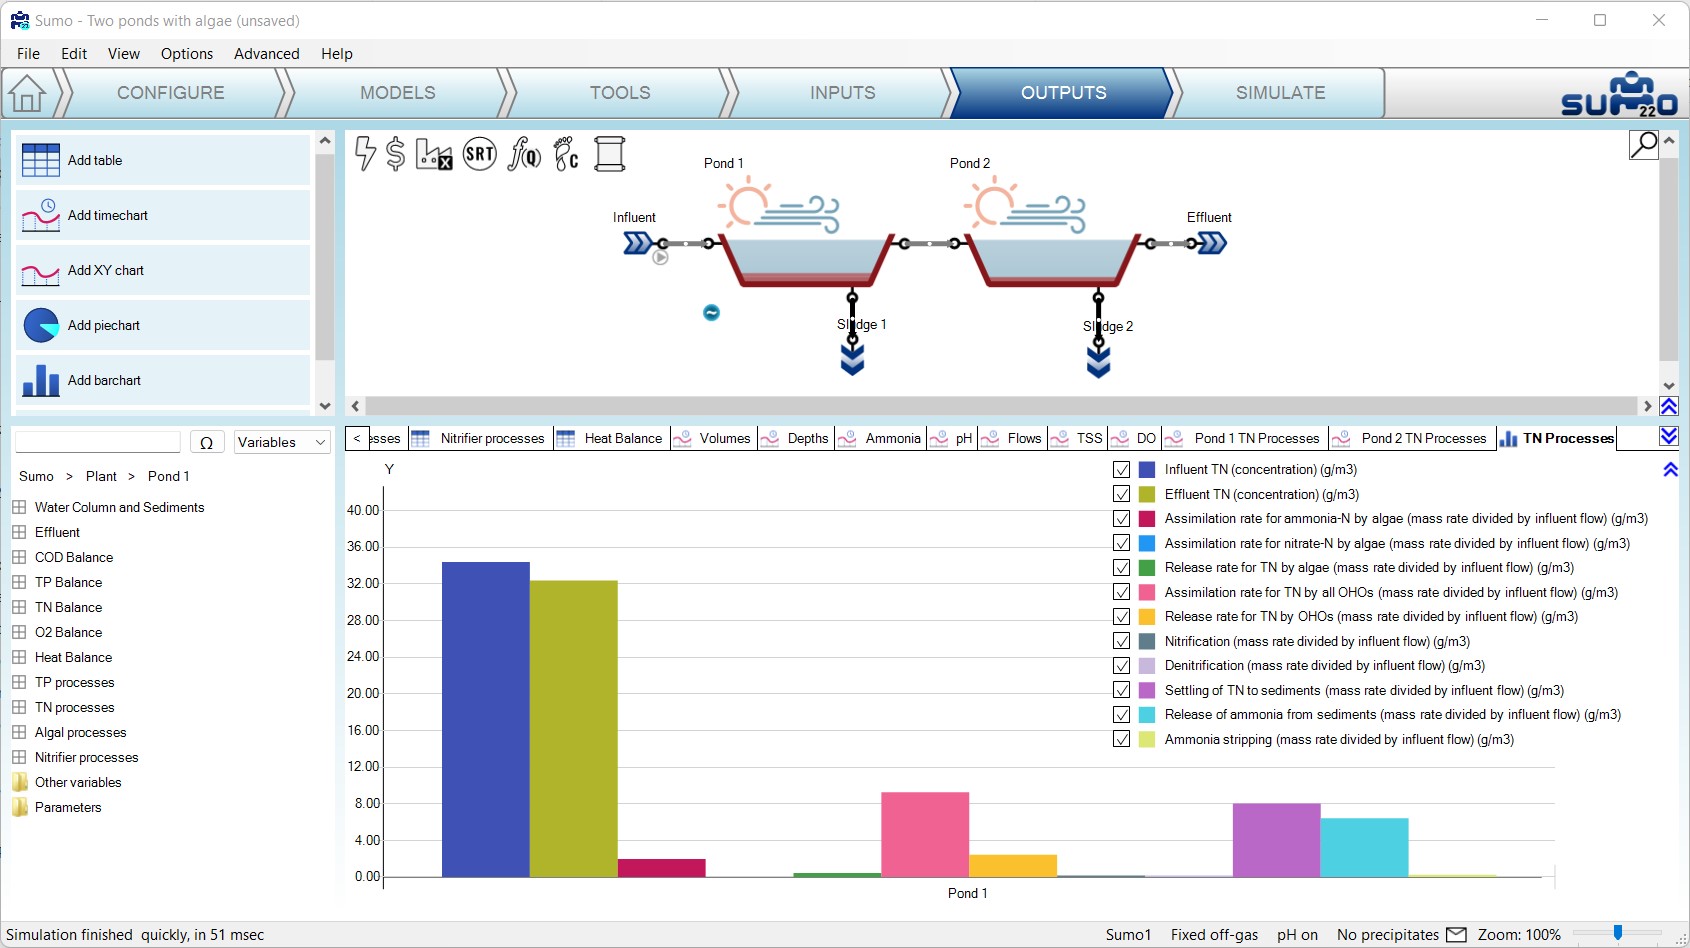
Conversion rates of interest to TP, TN, Algal and Nitrifier processes provide additional insight into Pond behavior. As illustrated in the Figure below, the purple bar "Settling of TN to sediments" is larger than the turquoise bar "Release of ammonia from sediments" indicating net accumulation of nitrogen in the Sediment layer. In addition the pink bar "Assimilation rate for TN by all OHOs" is of a similar magnitude to the settling rate of TN indicating the role of heterotrophic assimilation in the overall TN balance.
Investigating "Algal processes" and "Nitrifier processes" can provide insights into relative magnitude or growth rates, settling and washout rates into the effluent.
